Demonstrator
The goal of the demonstrator is to collect concrete feedback from key stakeholders and users, in order to provide a roadmap for the implementation of a future Digital Twin Component of the ESA DTE. To do so, we have implemented a demonstration platform based on a potential use-case: the unique combination of state-of-the-art developments in hydrology and geohazard sciences to represent in a holistic way the major environment-related hazards and water resource impacts faced by populations living in the Alps.
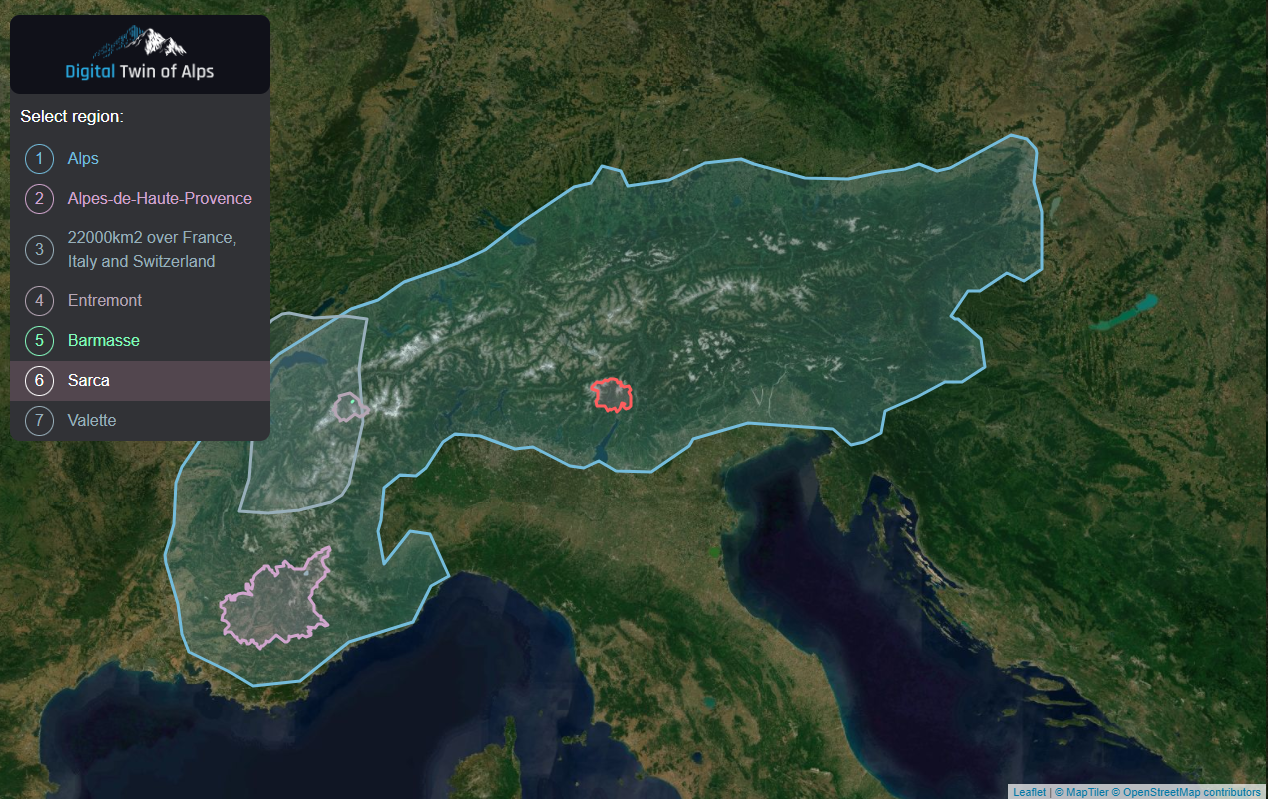
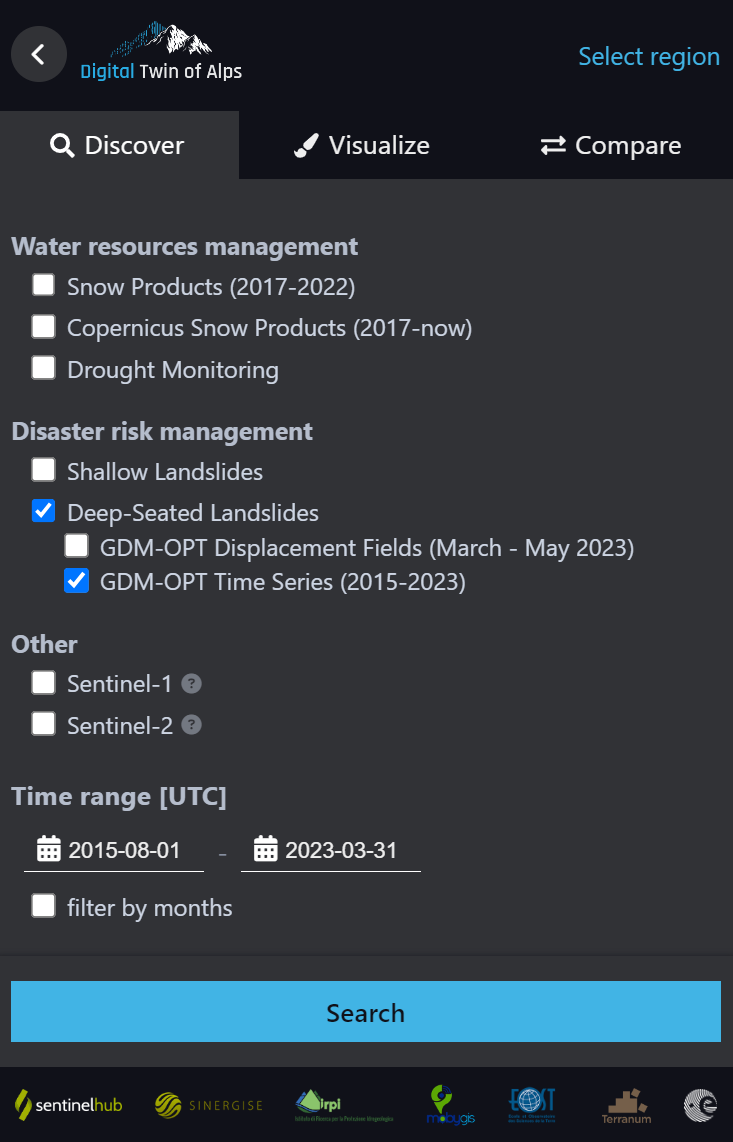
Get started with the demonstrator
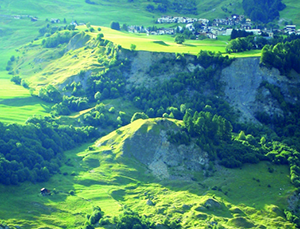
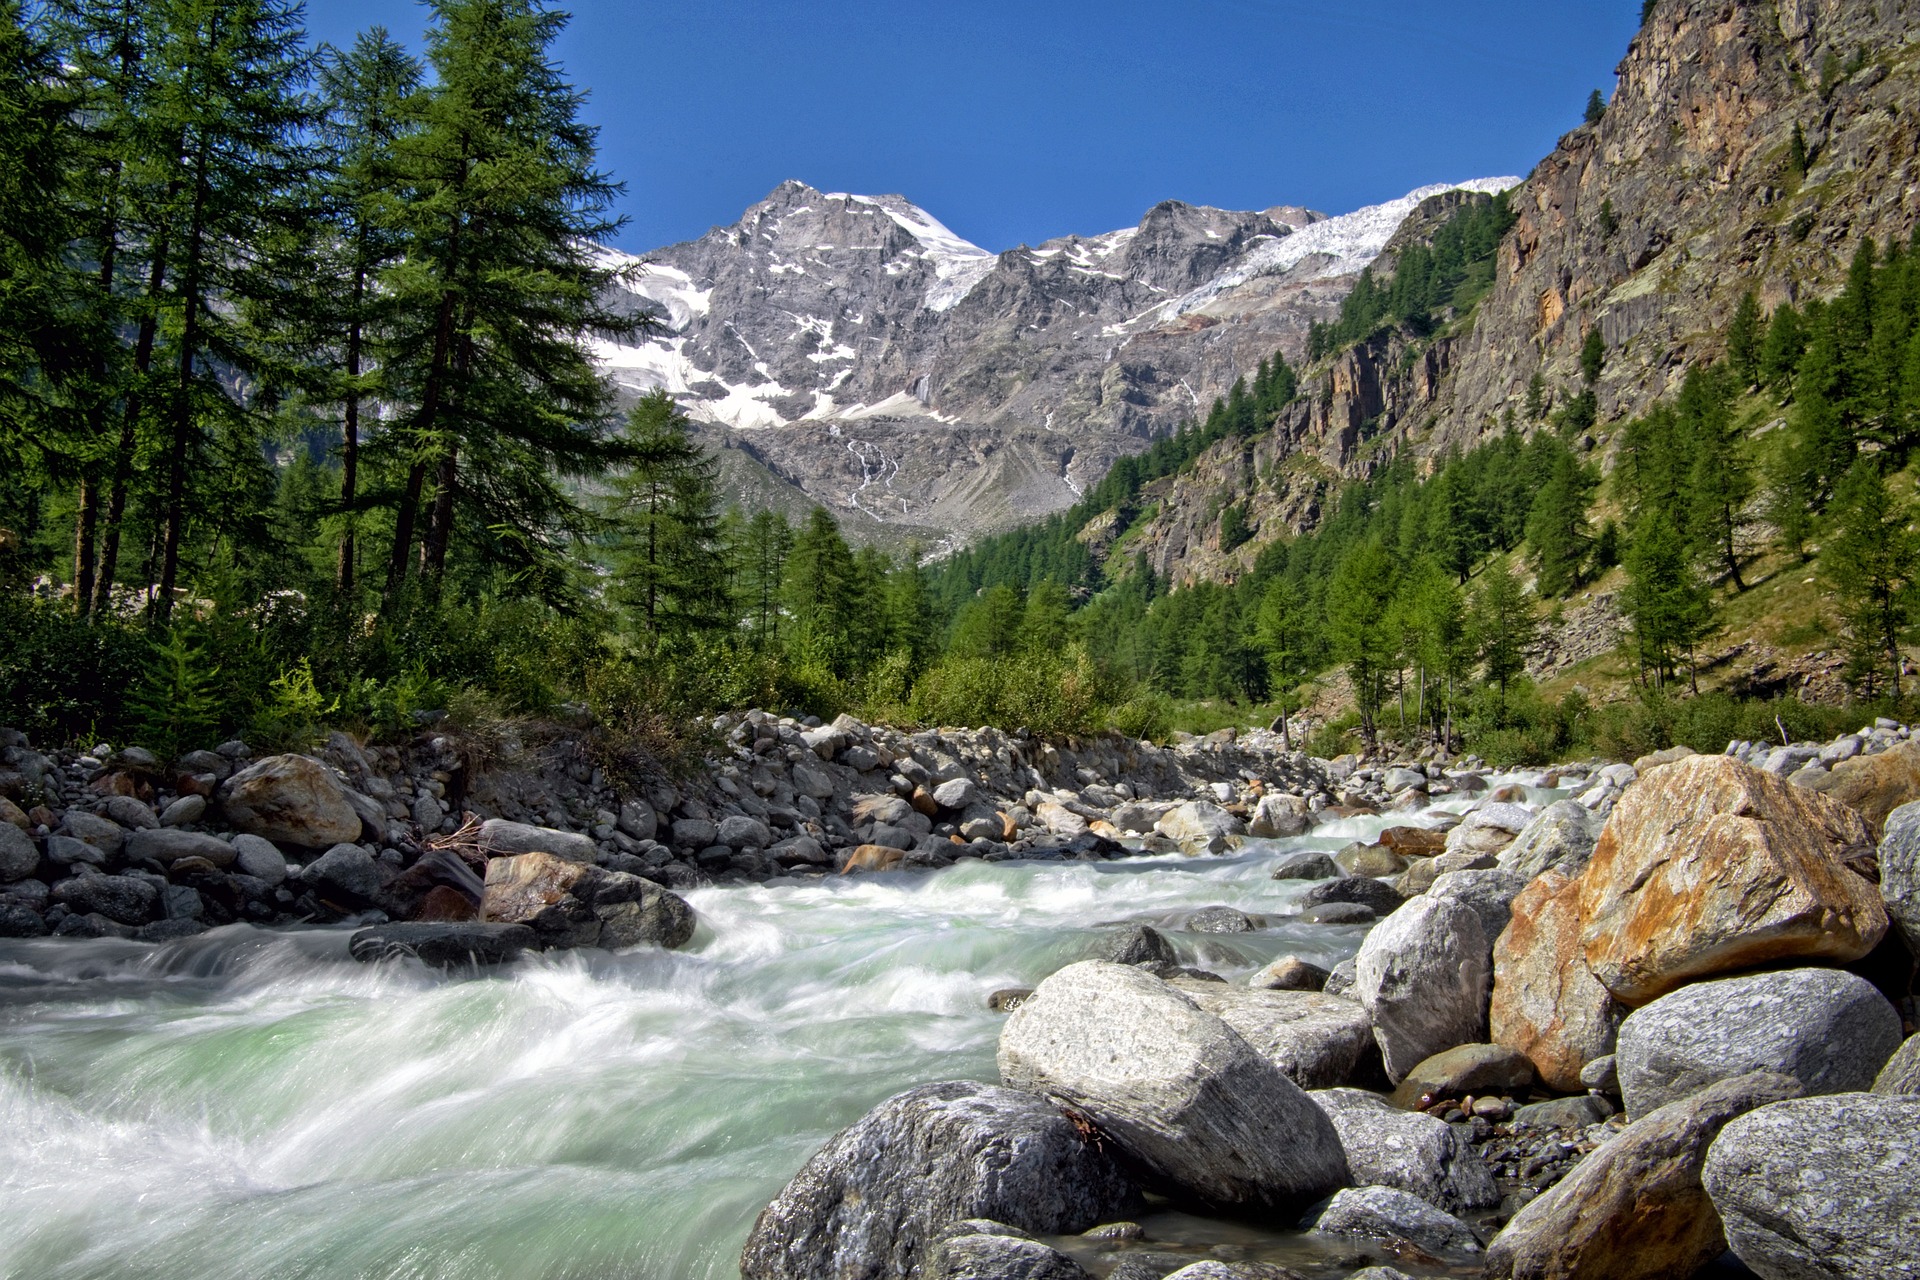
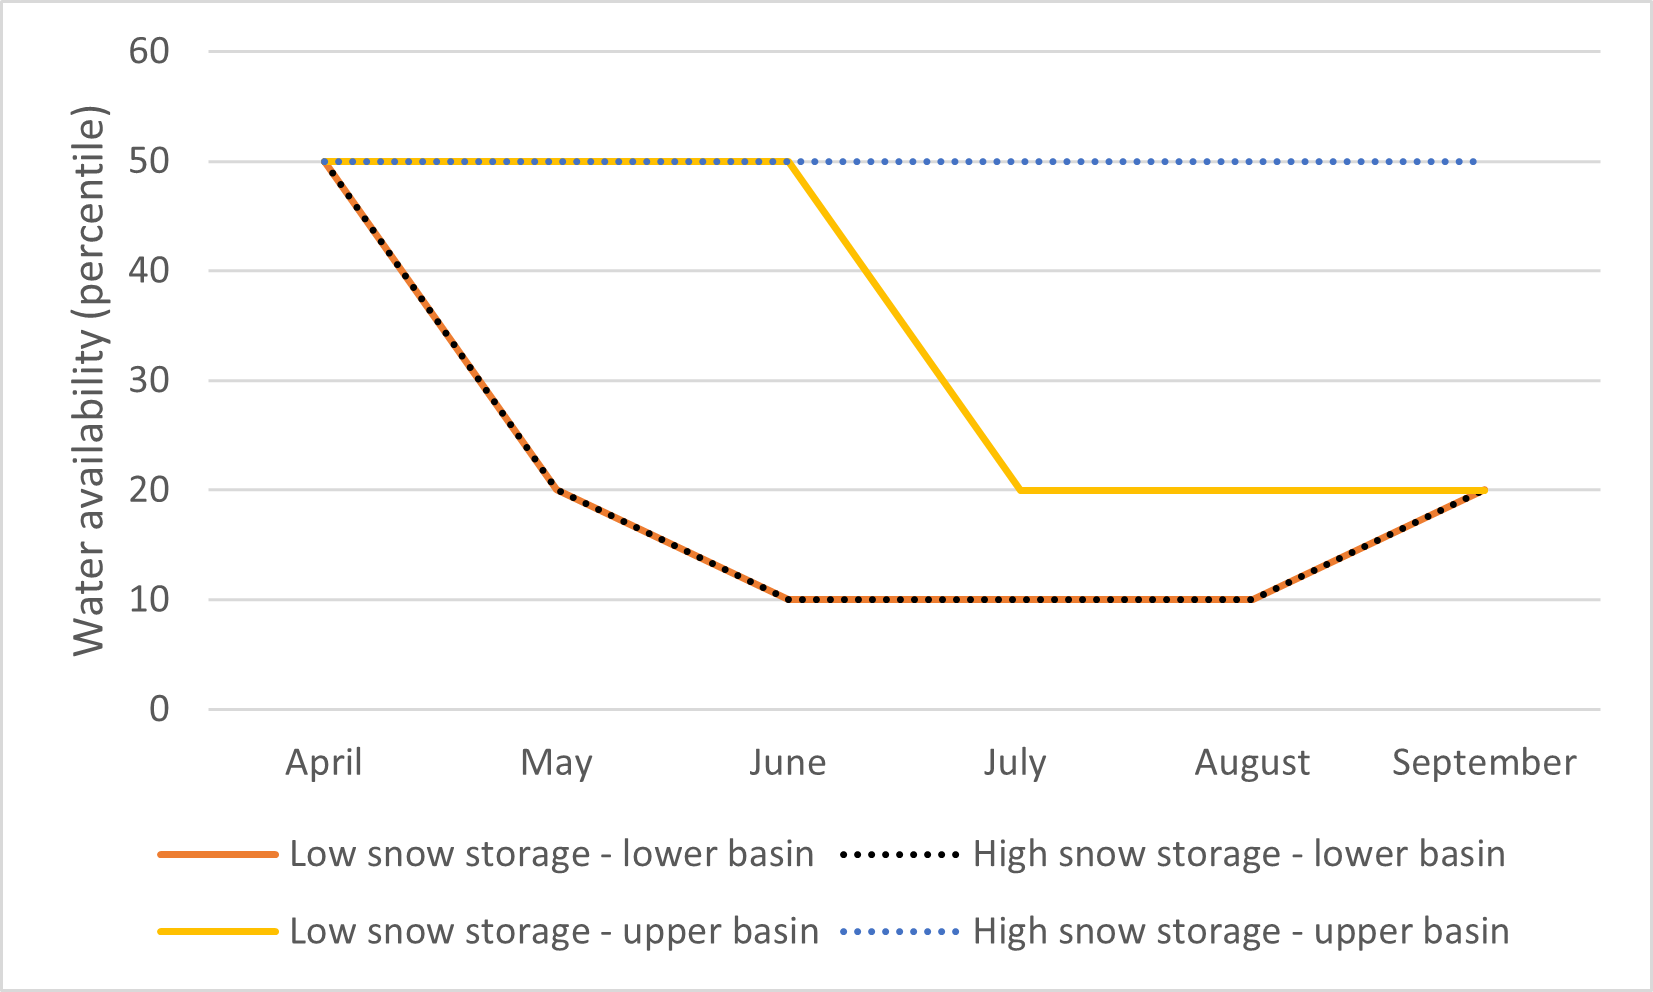
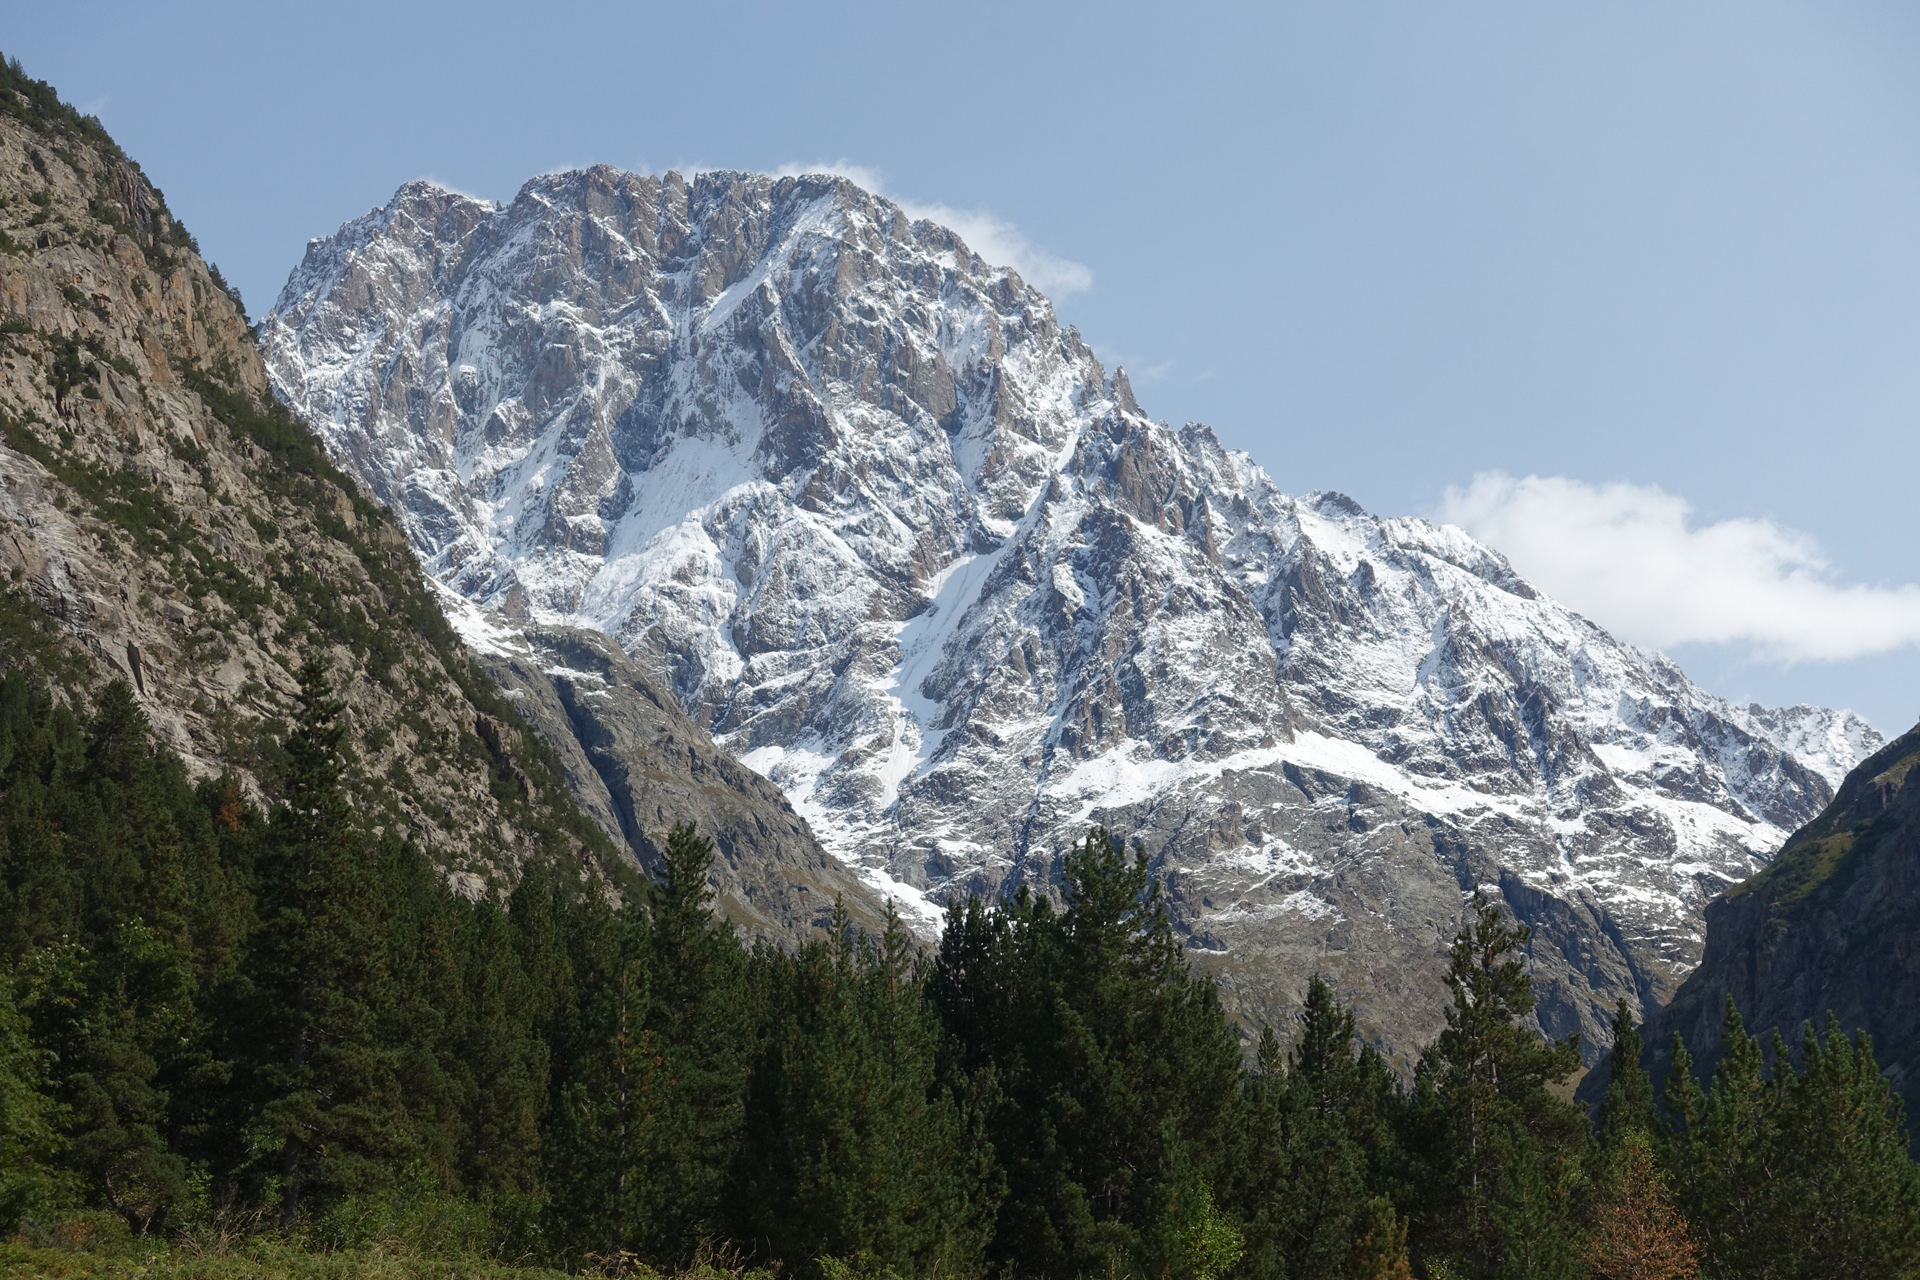
Water resource management in the Alps

Credit: Maxim Lamare
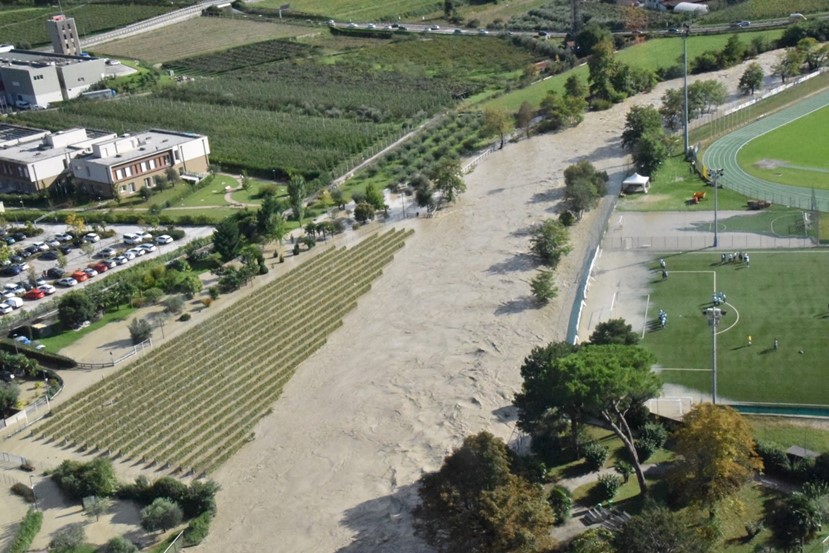
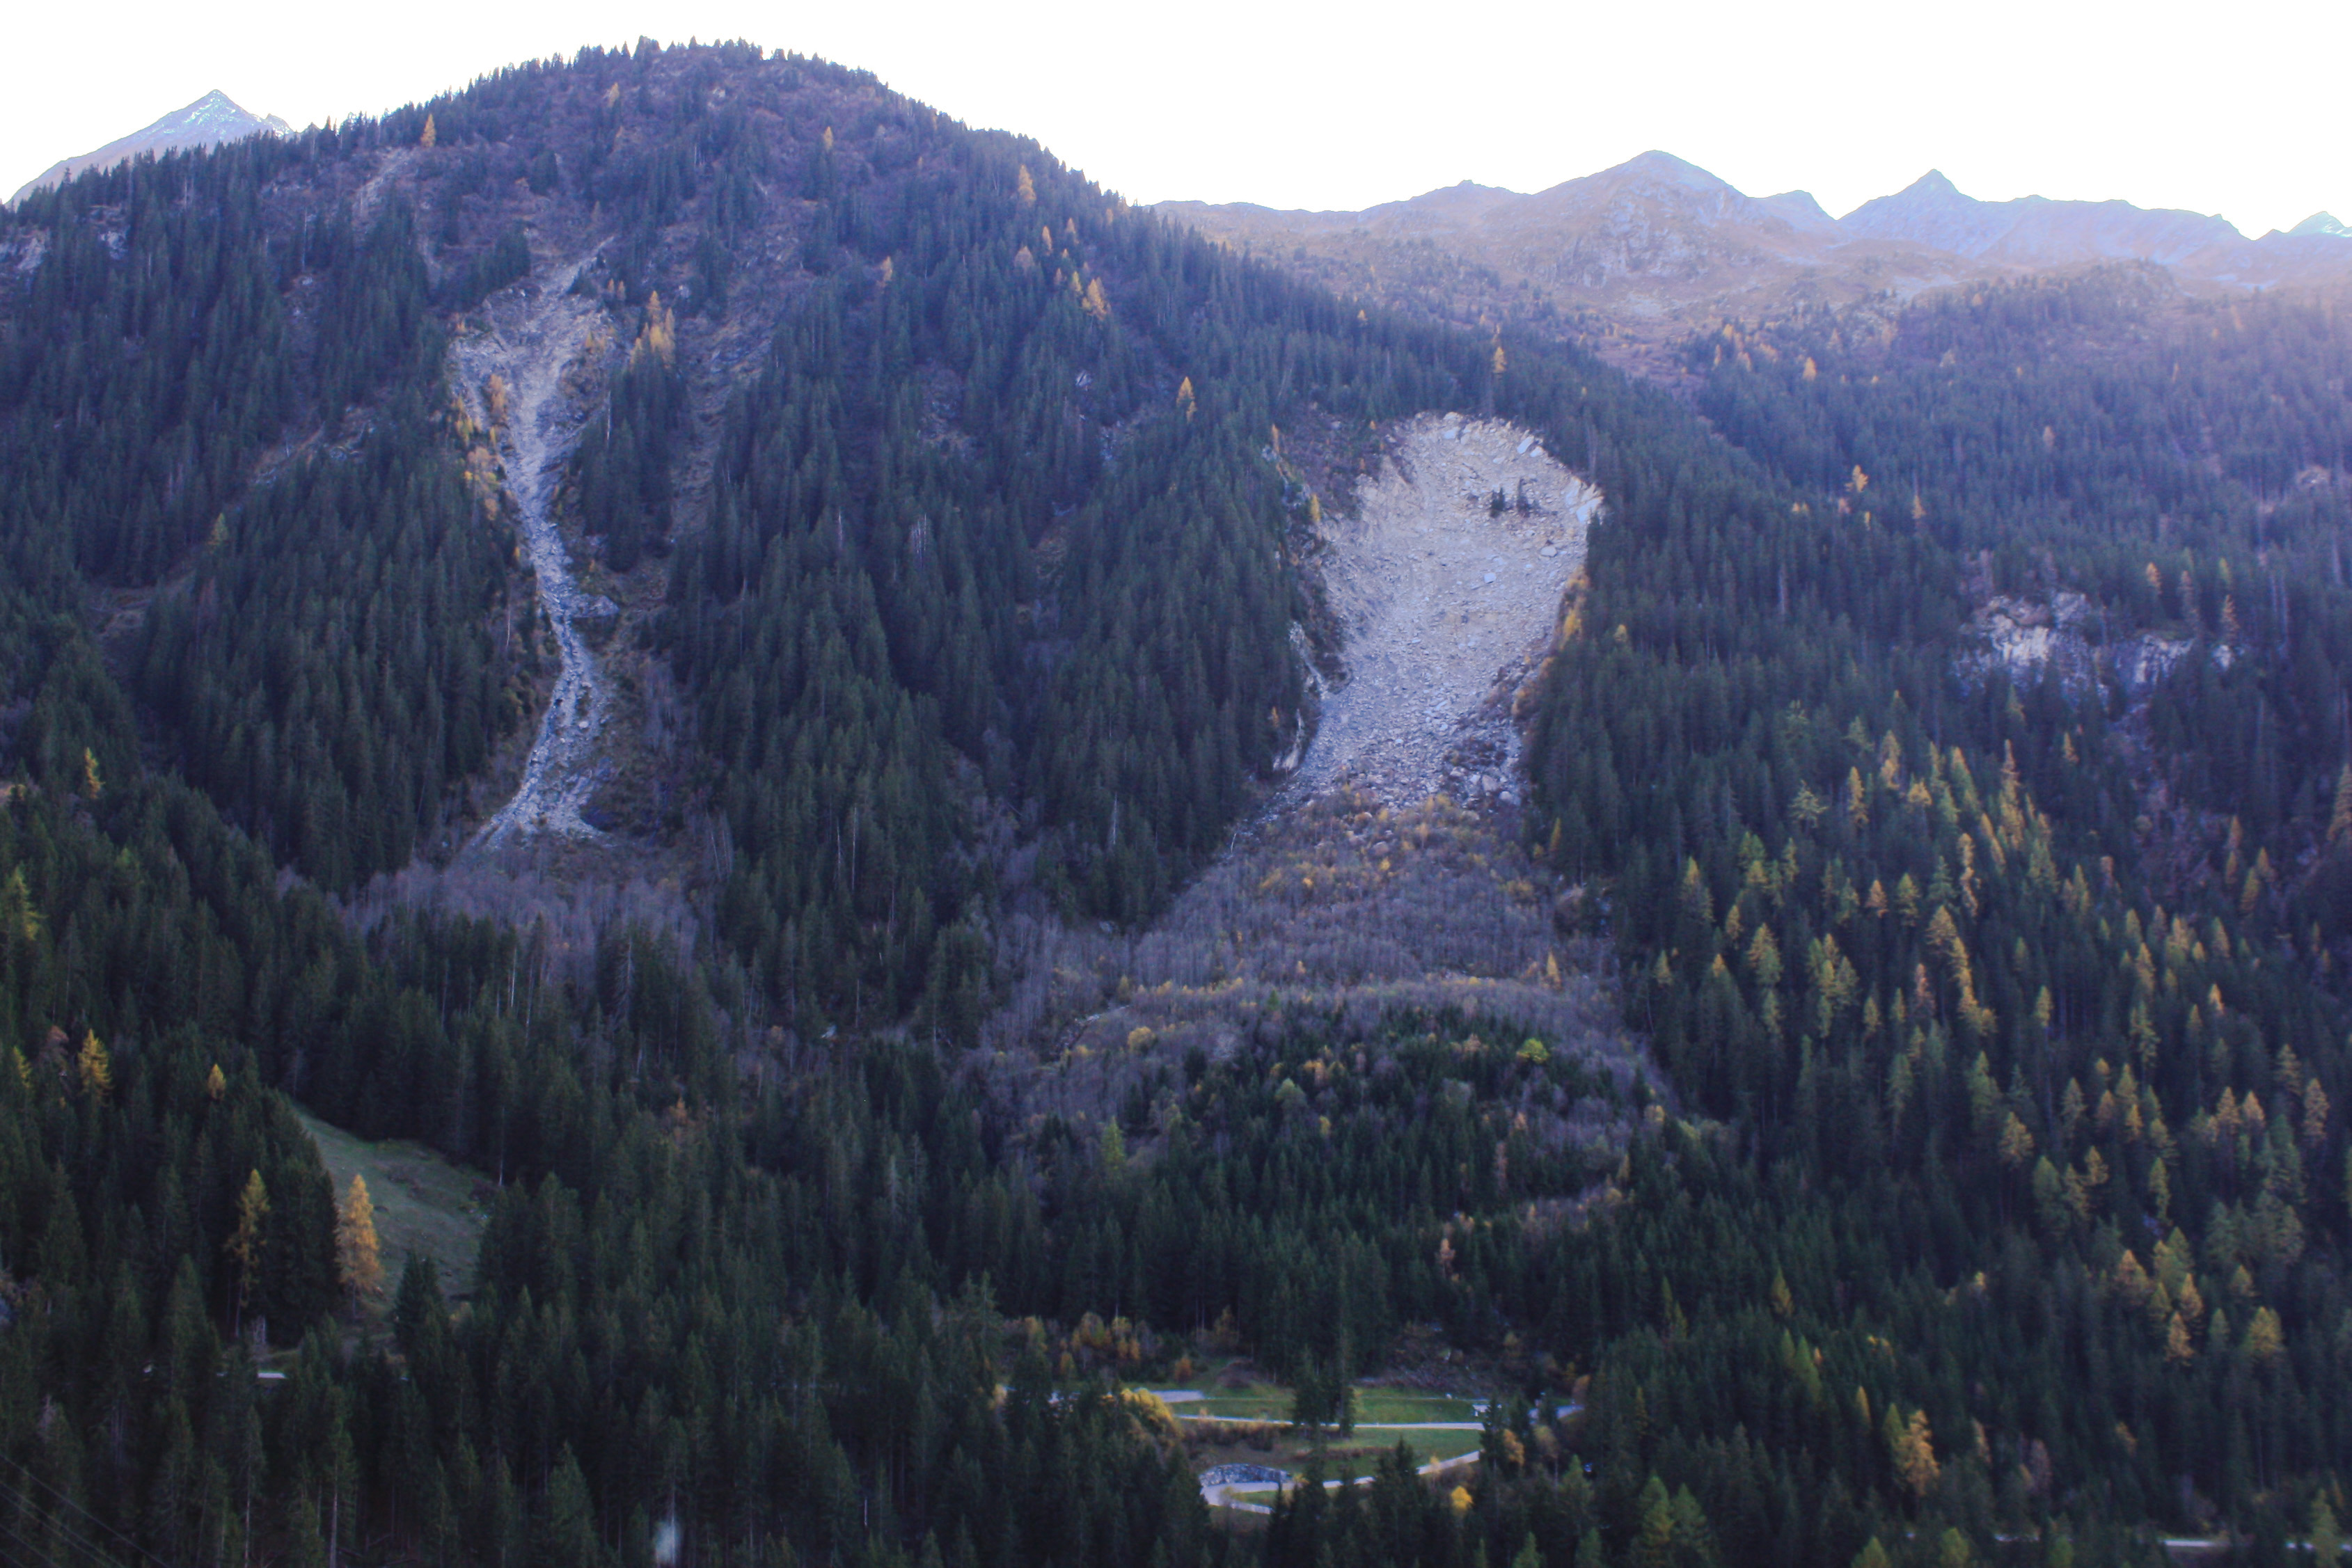
Disaster risk management in the Alps
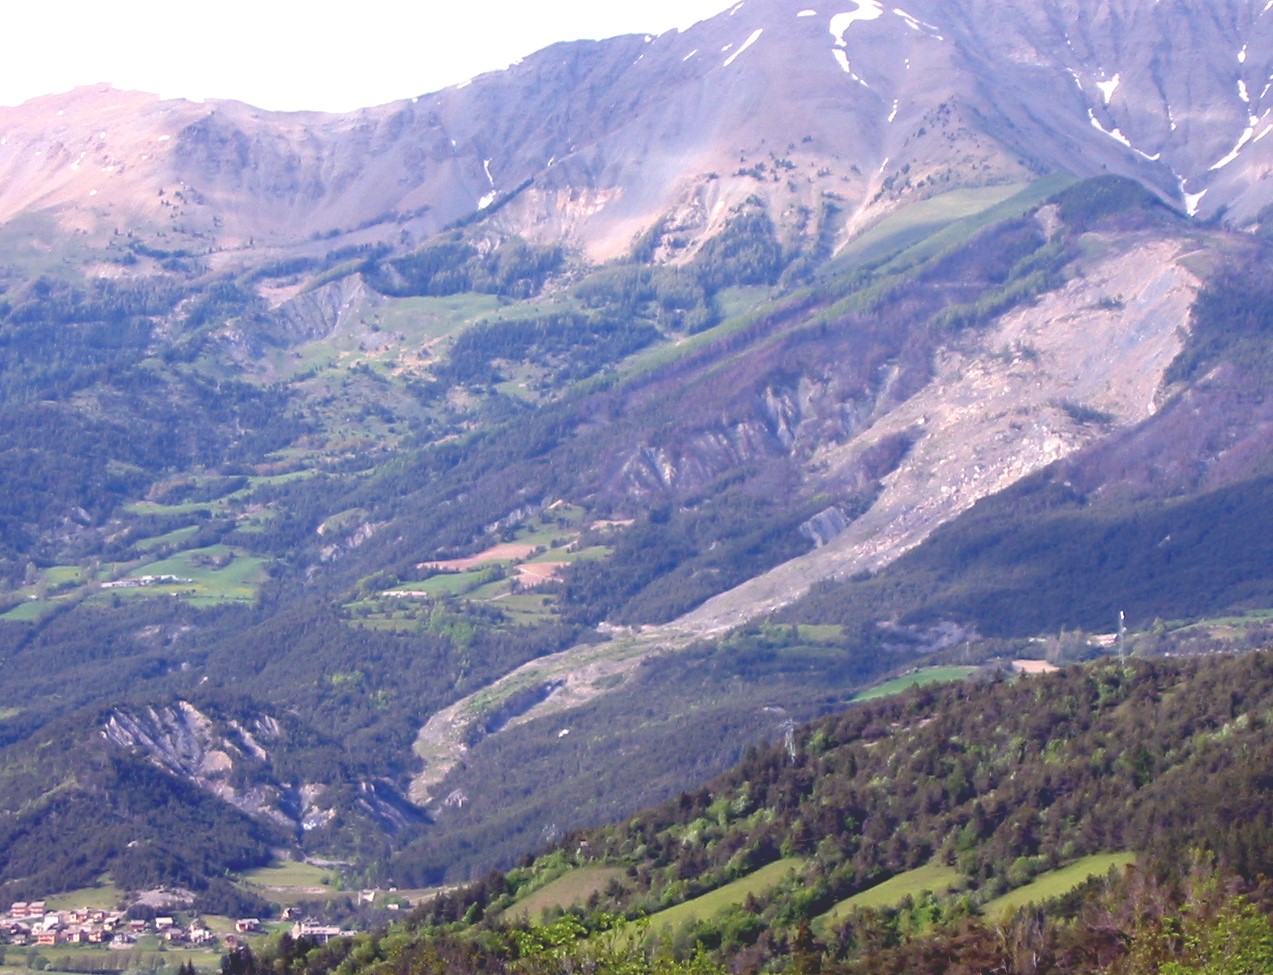
Credit: Jean-Philippe Malet.
Demonstrator services

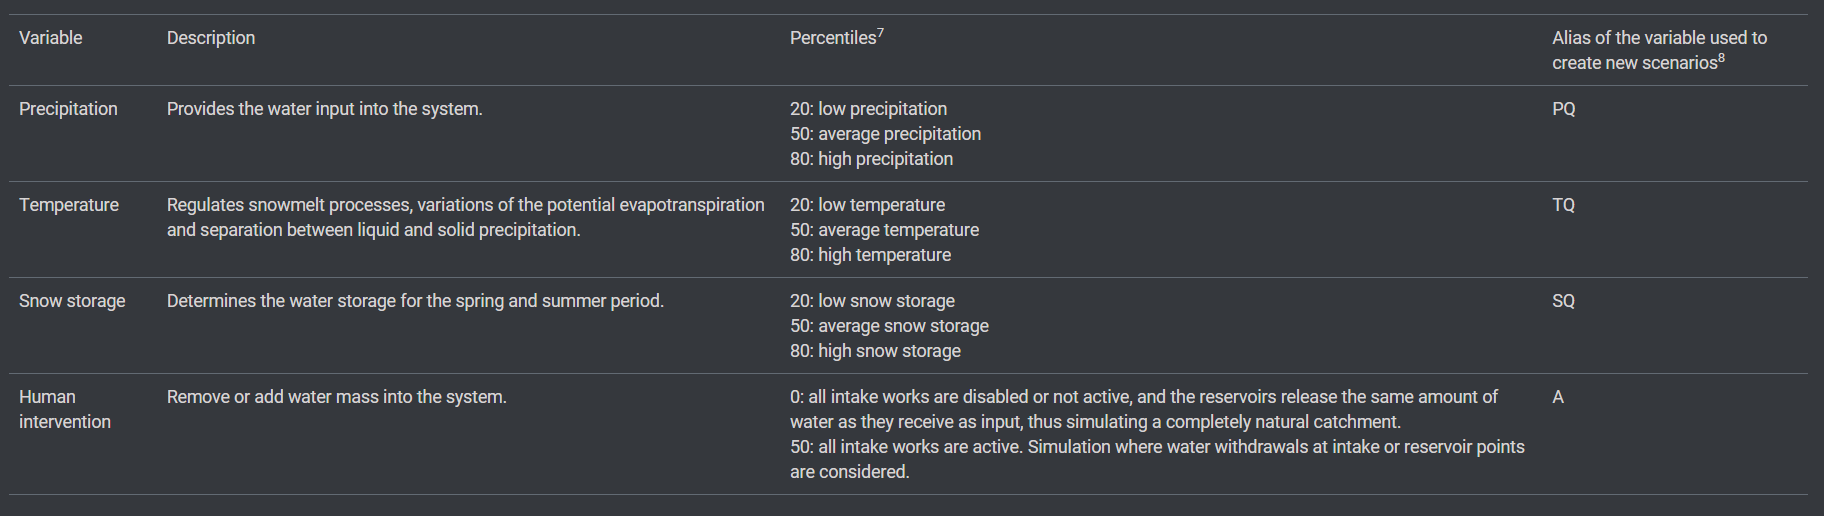
Water resource management services
Snow cover
Why monitor snow?
What is the snow processing chain?
How does the service work?
What products are available in the demonstrator?
- Daily snow water equivalent maps for the Alps area from 2017 to 2022
- Daily snow water equivalent maps for the Sarca river basin over the period 2002-2016
- Bi-monthly snow water equivalent anomaly maps in the Sarca area for the period 2017-2022
- Daily average temperature and total precipitation maps over the Sarca area for the period 2017-2022
- Daily snow depth maps for the Alps area from 2017 to 2022
- Weekly SCA maps for the Alps area from 2017 to 2022
- 3-day forecast snow melt maps for the Alps area from 2017 to 2022.
All the products listed above are generated with a spatial resolution of 250 x 250 m.

Example of the Snow Depth product over Mont Blanc region (23.02.2023).
Who is the service useful for?
Products from external providers
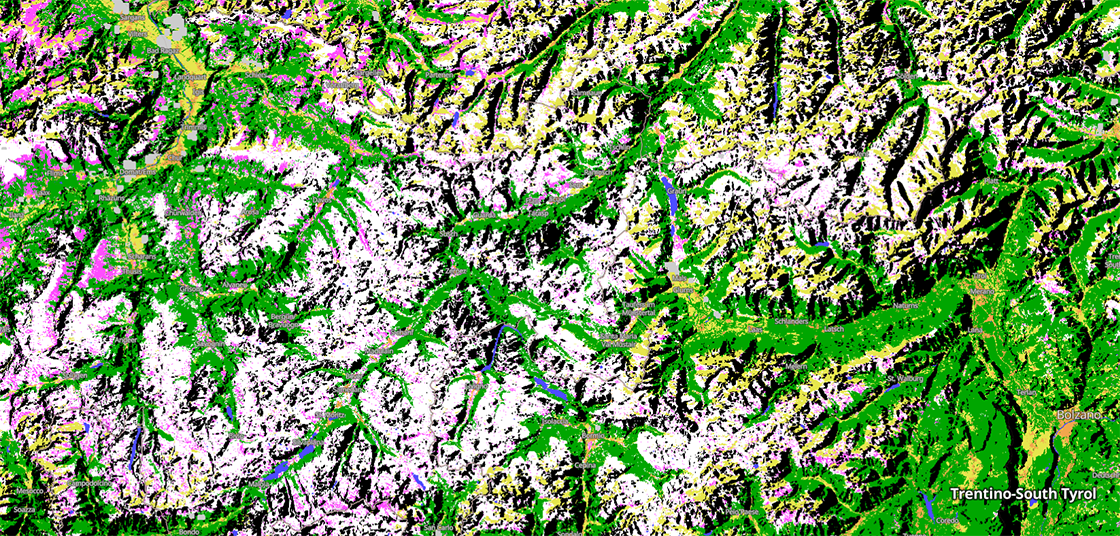
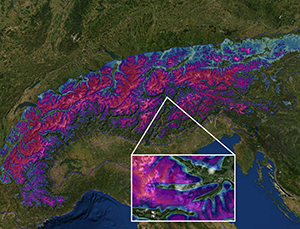
Snow State Classification in central Alps, where white represents dry snow and pink wet snow. For further information on the land cover categories represented in the map refer to the following documentation.
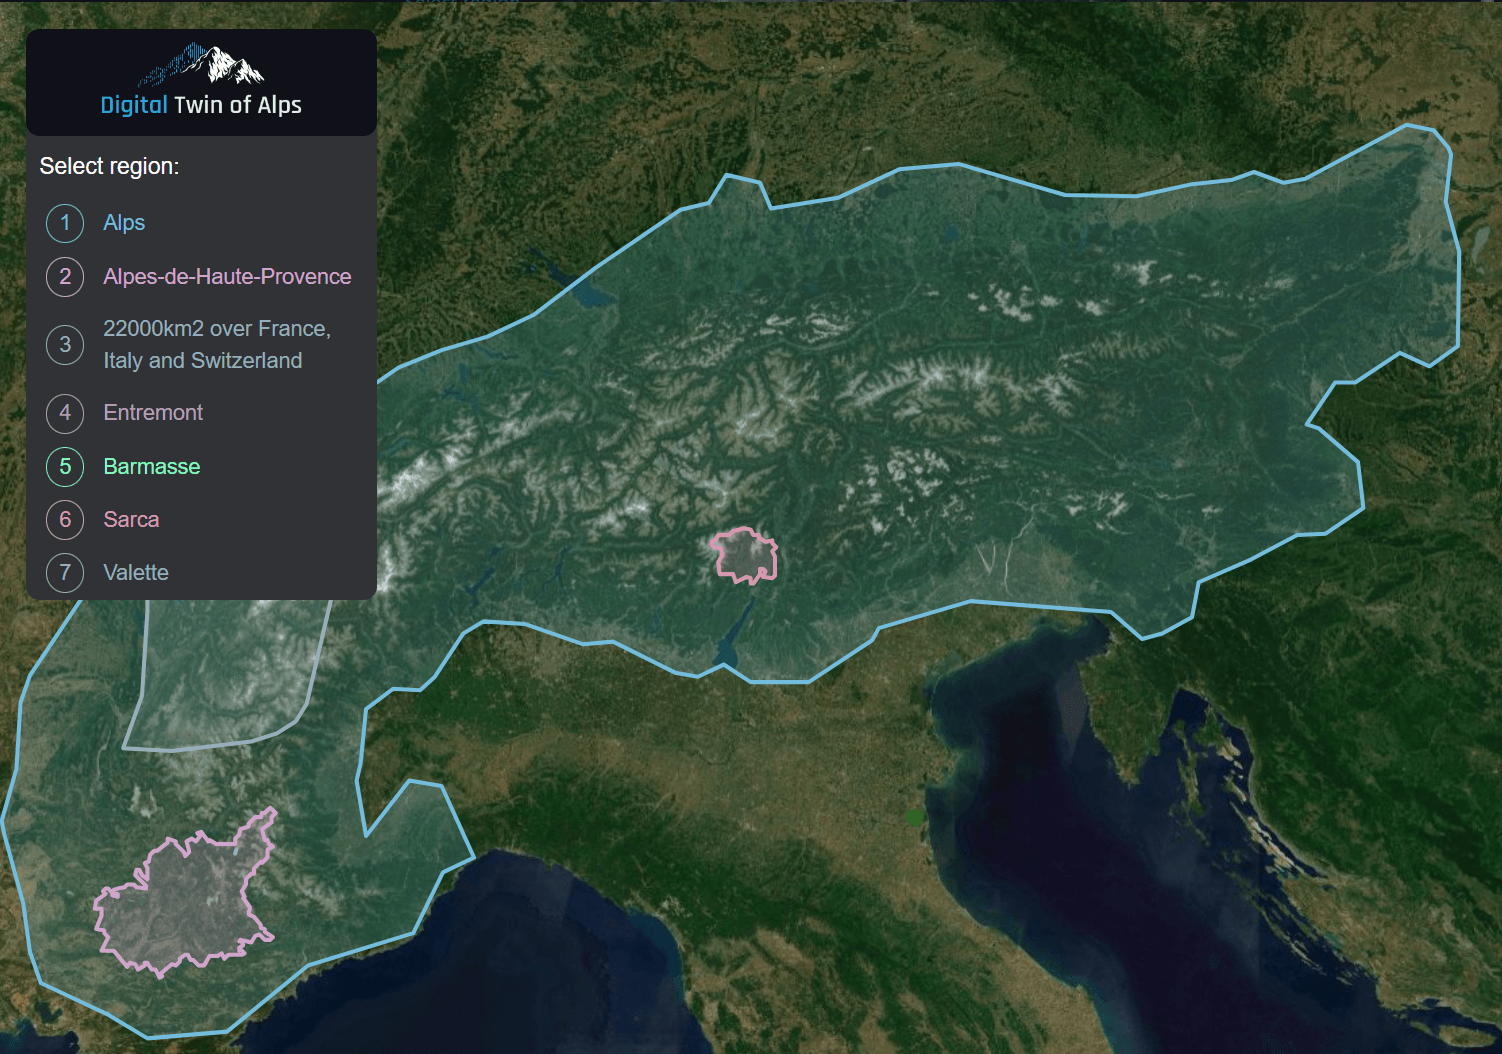
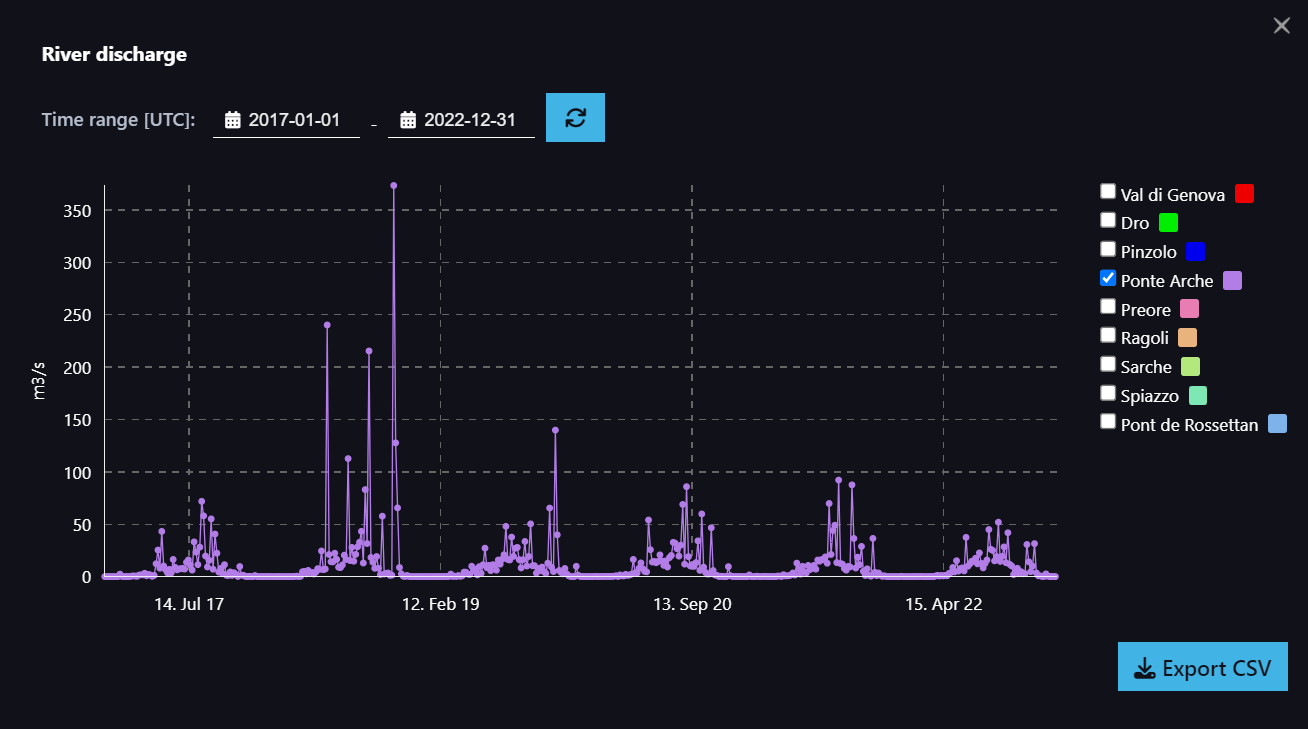
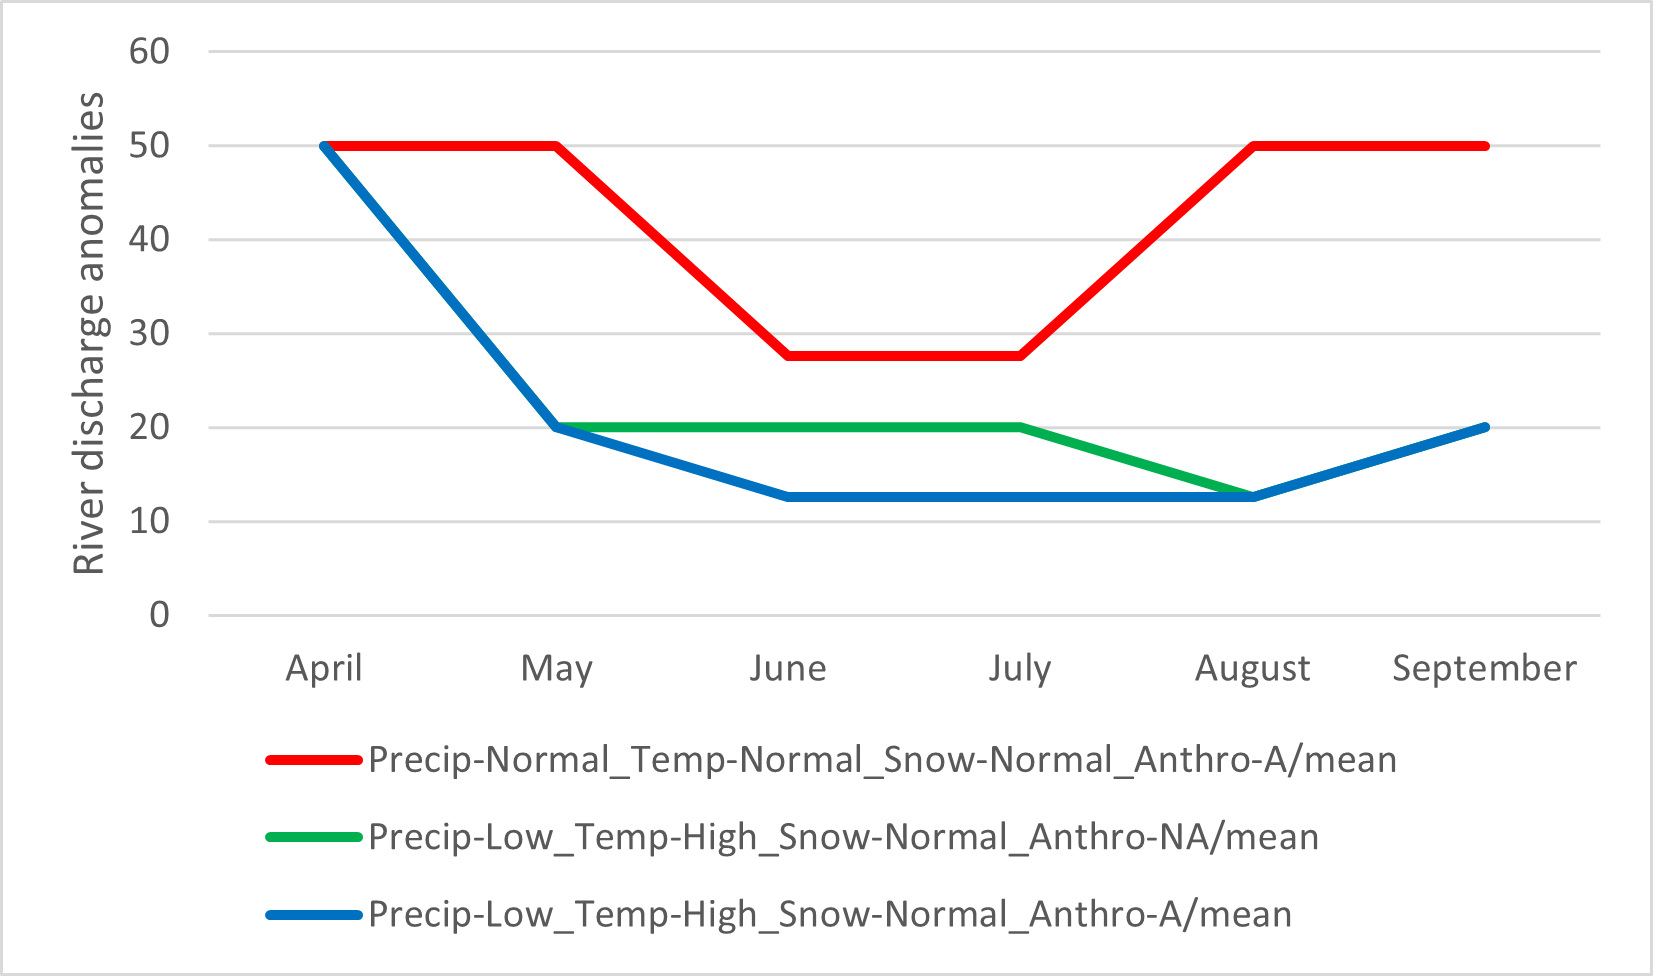
Water discharges and water heights
Why monitor rivers?
What is the water discharge processing chain?
How does the service work?
What products are available in the demonstrator?
- Soil moisture maps in mm including the water content in the soil and the water vapour with a spatial resolution of 250x250 m and an hourly time step
- River discharges as a temporal series in m³/s in one section of the Entremont catchment (Switzerland) and several sections of the Sarca catchment (Italy).
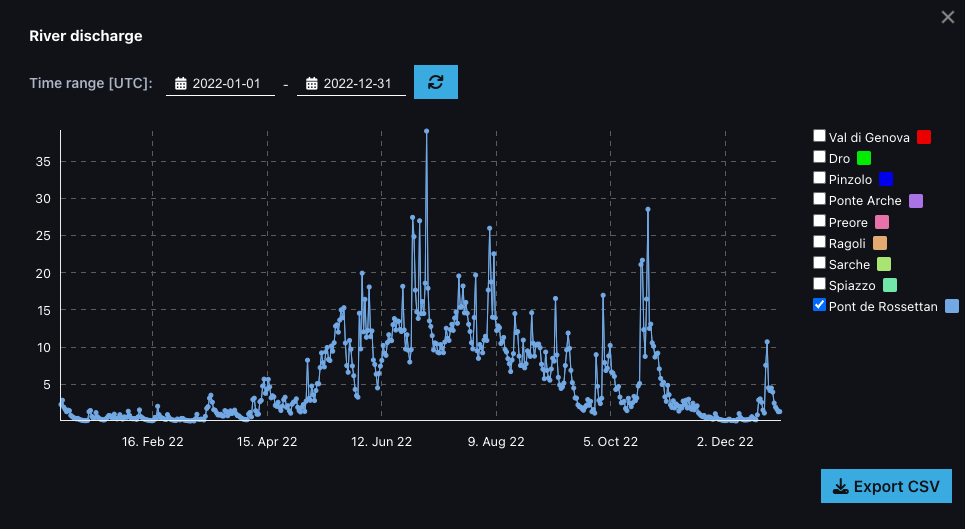
River discharge at the Pont de Rossettan site (Switzerland) over the year 2022.
Who is the service useful for?
Soil moisture/drought monitoring
Why monitor drought?
What is the drought processing chain?
How does the service work?
What products are available in the demonstrator?
- precipitation from a satellite-based dataset derived by the merging of different satellite products (developed within the ESA 4DMED Hydrology and ESA DTE Hydrology projects)
- evapotranspiration from a new implementation of the GLEAM product at 1 km spatial resolution (developed within the ESA 4DMED Hydrology and ESA DTE Hydrology projects)
- evapotranspiration outputs from the NewAge Hydrological model
- soil moisture from the satellite-based PLANET SMAP soil moisture dataset
- soil moisture outputs from the NewAge Hydrological model
- Snow Water Equivalent (SWE) developed in the snow processing chain.

Example of the Evapotranspiration Anomaly product derived from GLEAM over Entremont region in Switzerland in August 2021.
Who is the service for?
Disaster risk management services

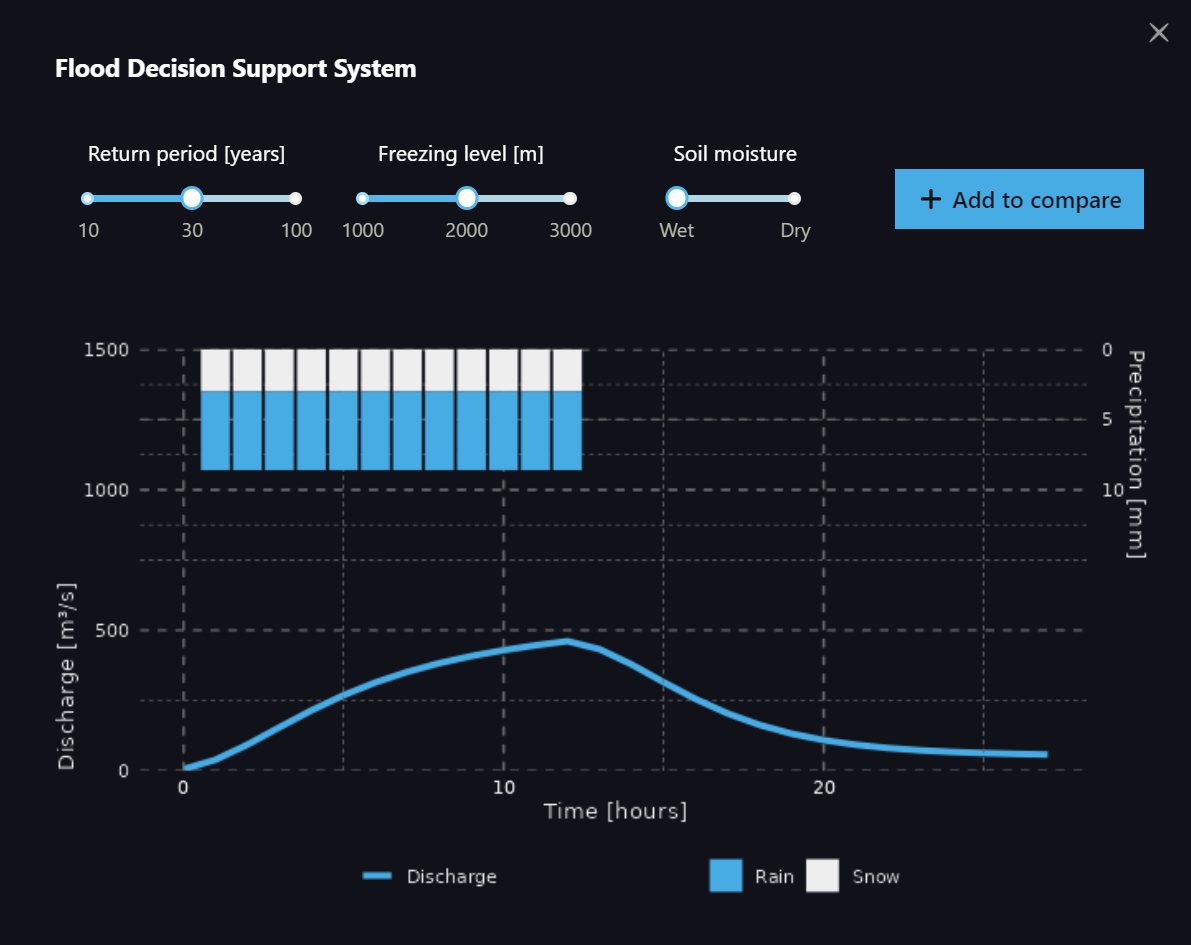
Flooding
Why monitor floods?
What is the flood processing chain?
How does the service work?
What products are available in the demonstrator?

Map of the modelled flood of the Sarca River between 3-4 October 2020.
Who is the service for?
Shallow landslides
Why observe shallow landslides?
What is the shallow landslide chain?
Failure susceptibility is the geomechanical capability of slopes to fail as shallow landslides; it locates the potential source areas.
Propagation susceptibility locates areas that can be reached by the runout of moving muddy material in case of shallow landslide triggering.
How does the service work?
What products are available in the demonstrator?
- Topographic hillshade, derived from a 5m resolution DEM (swisstopo) used as inputs to the landslide processing chain.
- Land-use classes (based on anthropogenic activities, geological maps and vegetation) used to assign hydrological and geomechanical parameters controlling soil stability.
- Maximum rainfall (in mm) for a rainfall event with 24h duration and a return period of 100 years from the Hydrological Atlas of Switzerland.
- Minimum rainfall (in mm) for a rainfall event with 24h duration and a return period of 100 years from the Hydrological Atlas of Switzerland.
- Static shallow landslide source area susceptibility map. The map distinguishes 5 landslide susceptibility classes based on the infinite slope stability model using a stochastic combination of hydrological and geomechanical parameters derived from the landuse map.
- Cumulative precipitation (in mm) for the next three days (D0 to D+3) based on meteorological forecasts. These precipitation forecasts are combined with precipitations measurements of the past 3 days (D-3 to D-1) into an antecedent rainfall index with predefined weights.
- Forecasted shallow landslides source areas. Source areas from the static susceptibility map for shallow landslides are forecasted as potentially active, when the antecedent rainfall index exceeds predefined thresholds (15 mm for unstable and very unstable sources, 20 mm for all sources).
- Forecasted shallow landslides runout areas. The runout area of shallow landslides starting from forecasted source areas is modelled with Flow-R with predefined parameters for two scenarios: mudflow-like propagation (reach angle: 19°, maximum velocity: 8 m/s) and normal short propagation (reach angle: 27°, maximum velocity: 2 m/s).
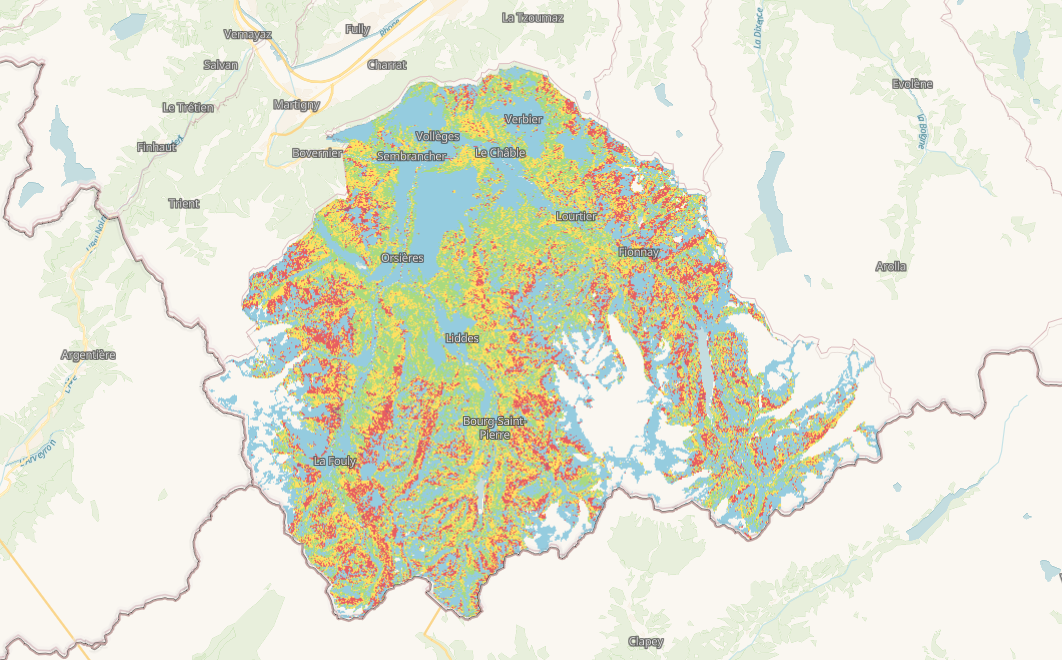
Map of the Shallow Landslide Source Susceptibility in Entremont district (Switzerland) in 2023.
Who is the service for?

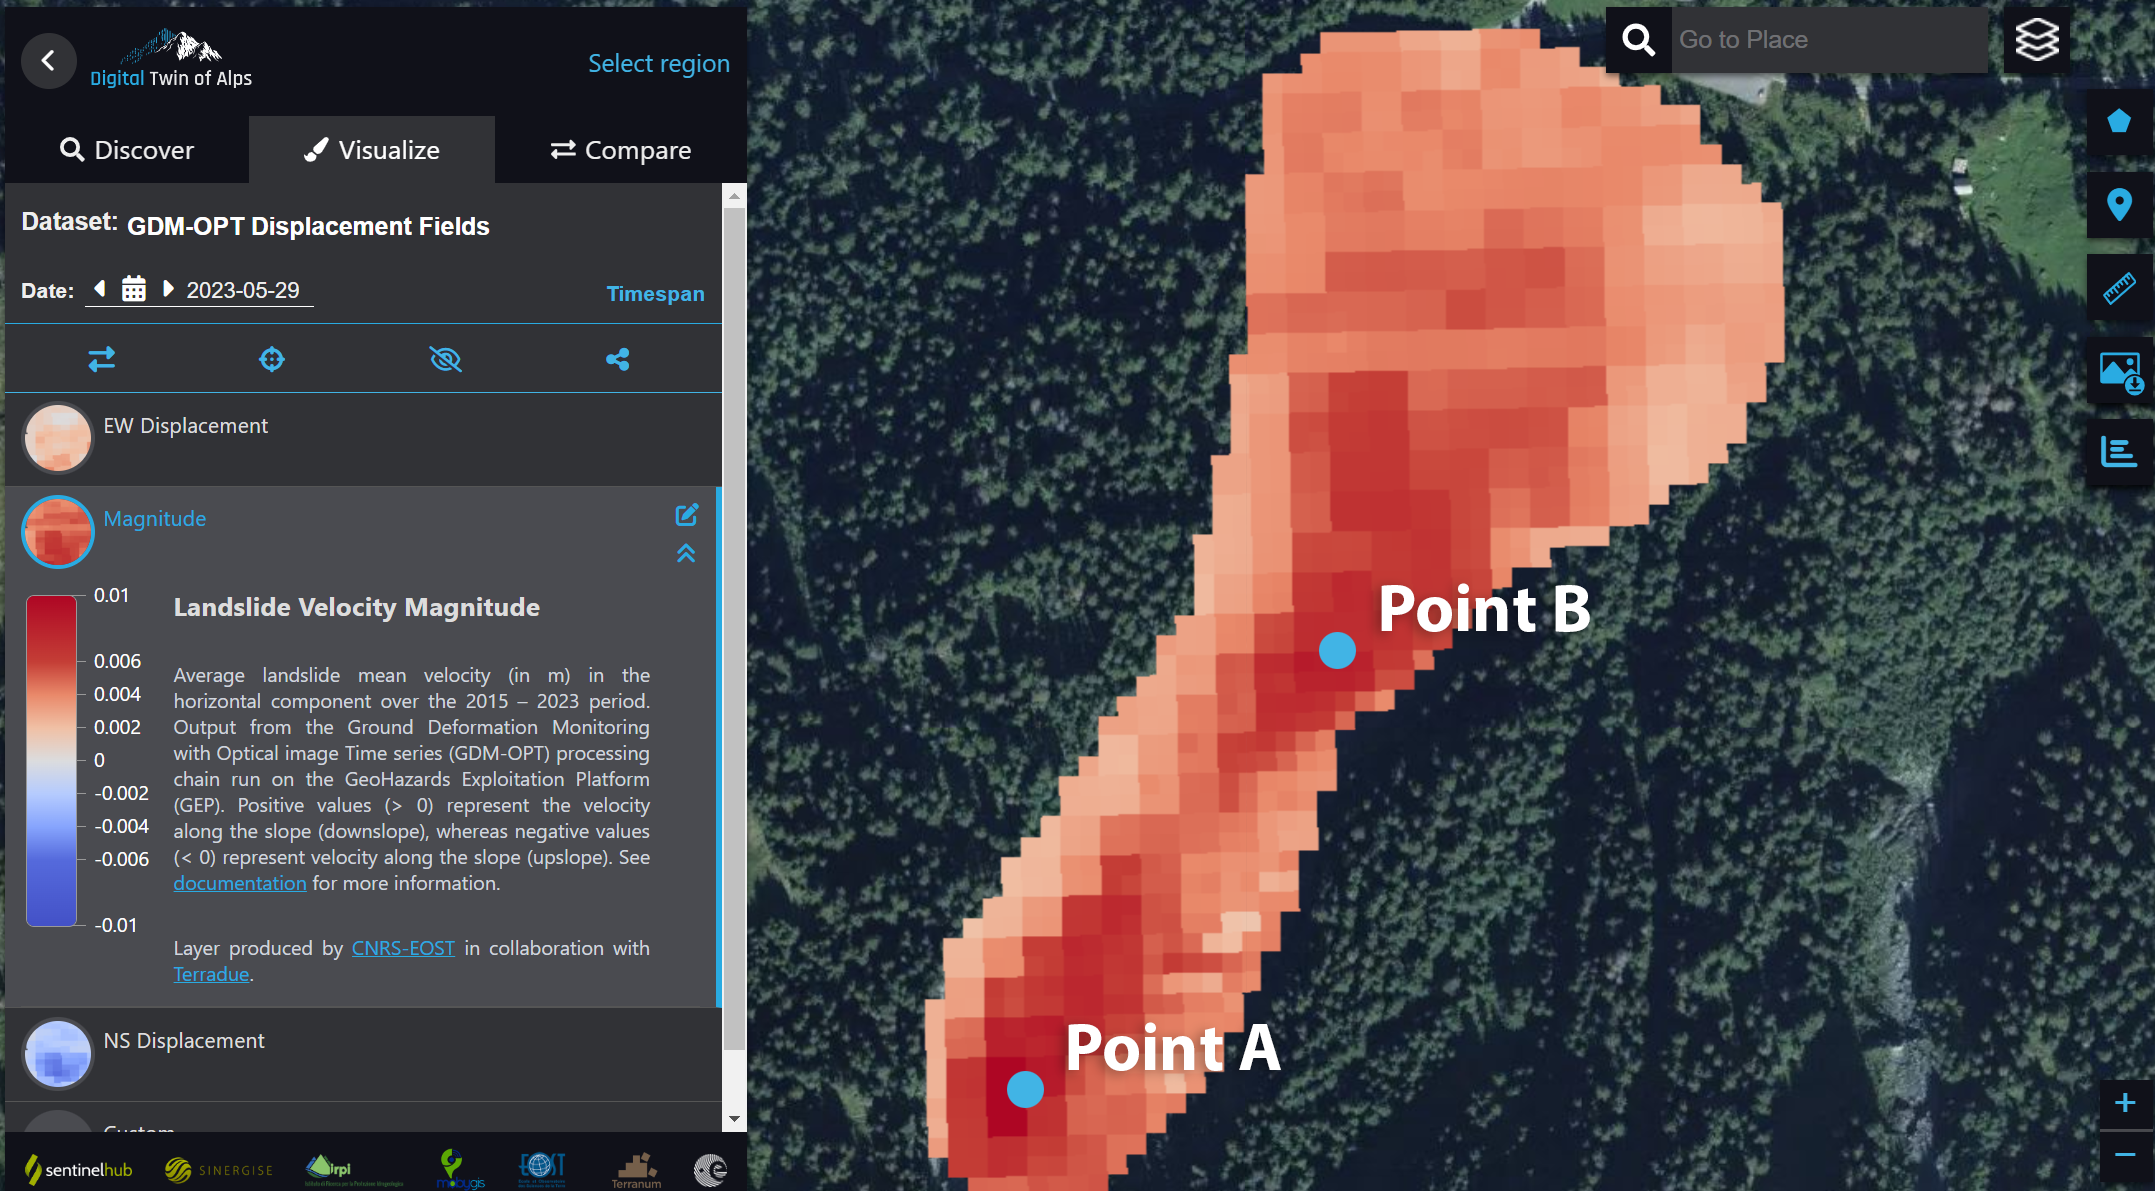
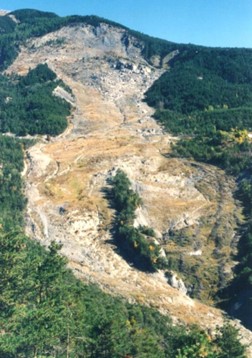
Large, deep slope failures, mostly deep-seated landslides and rockslides
Why monitor deep-seated landslides?
What is the deep-seated landslide chain?
How does the service work?
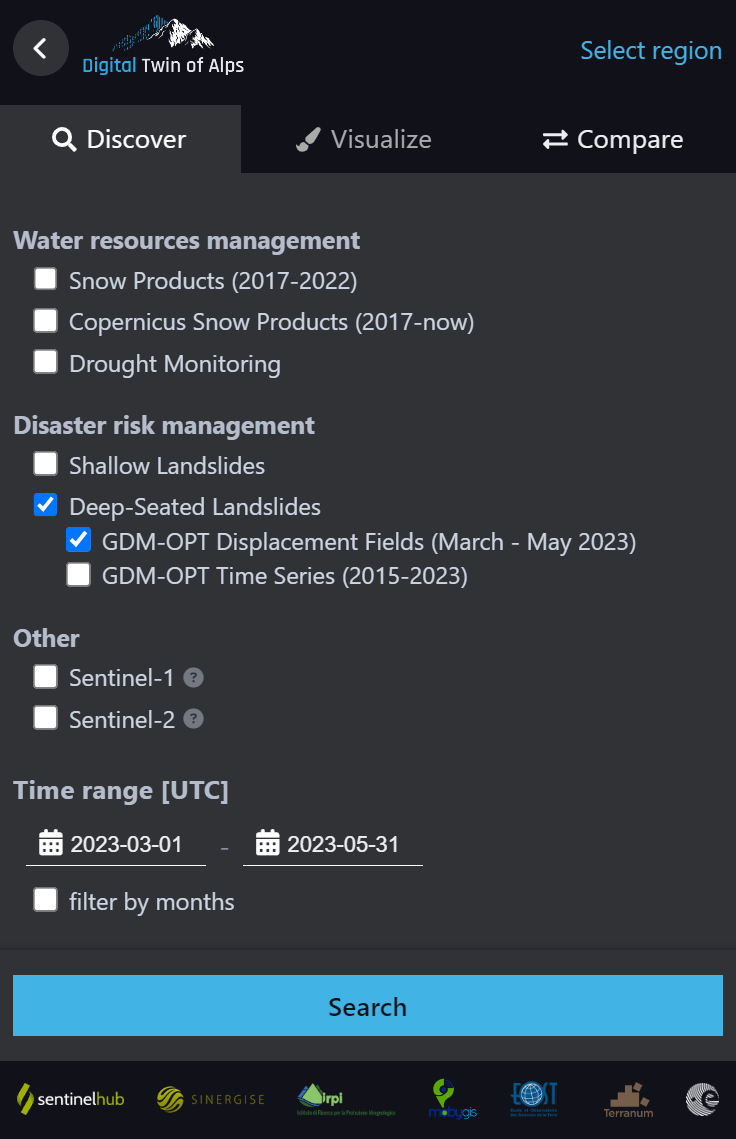
What products are available in the demonstrator?
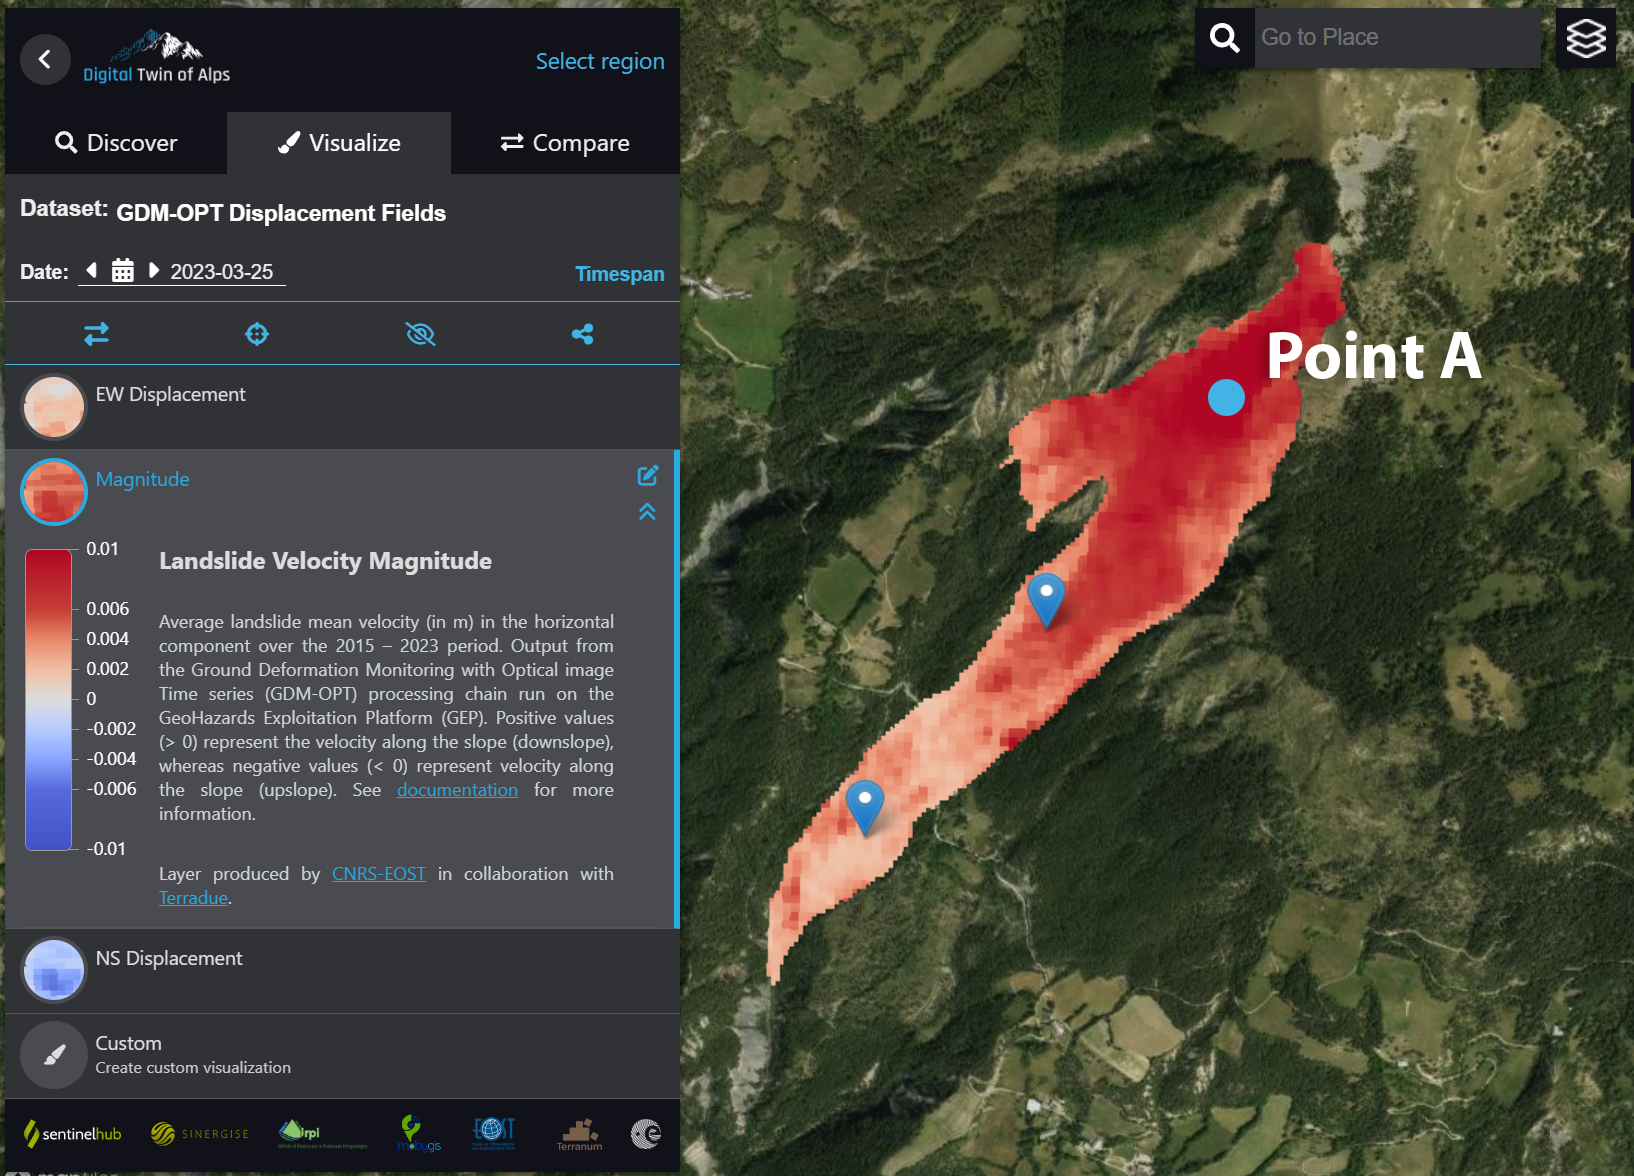
- Average horizontal velocity map (in m/day)
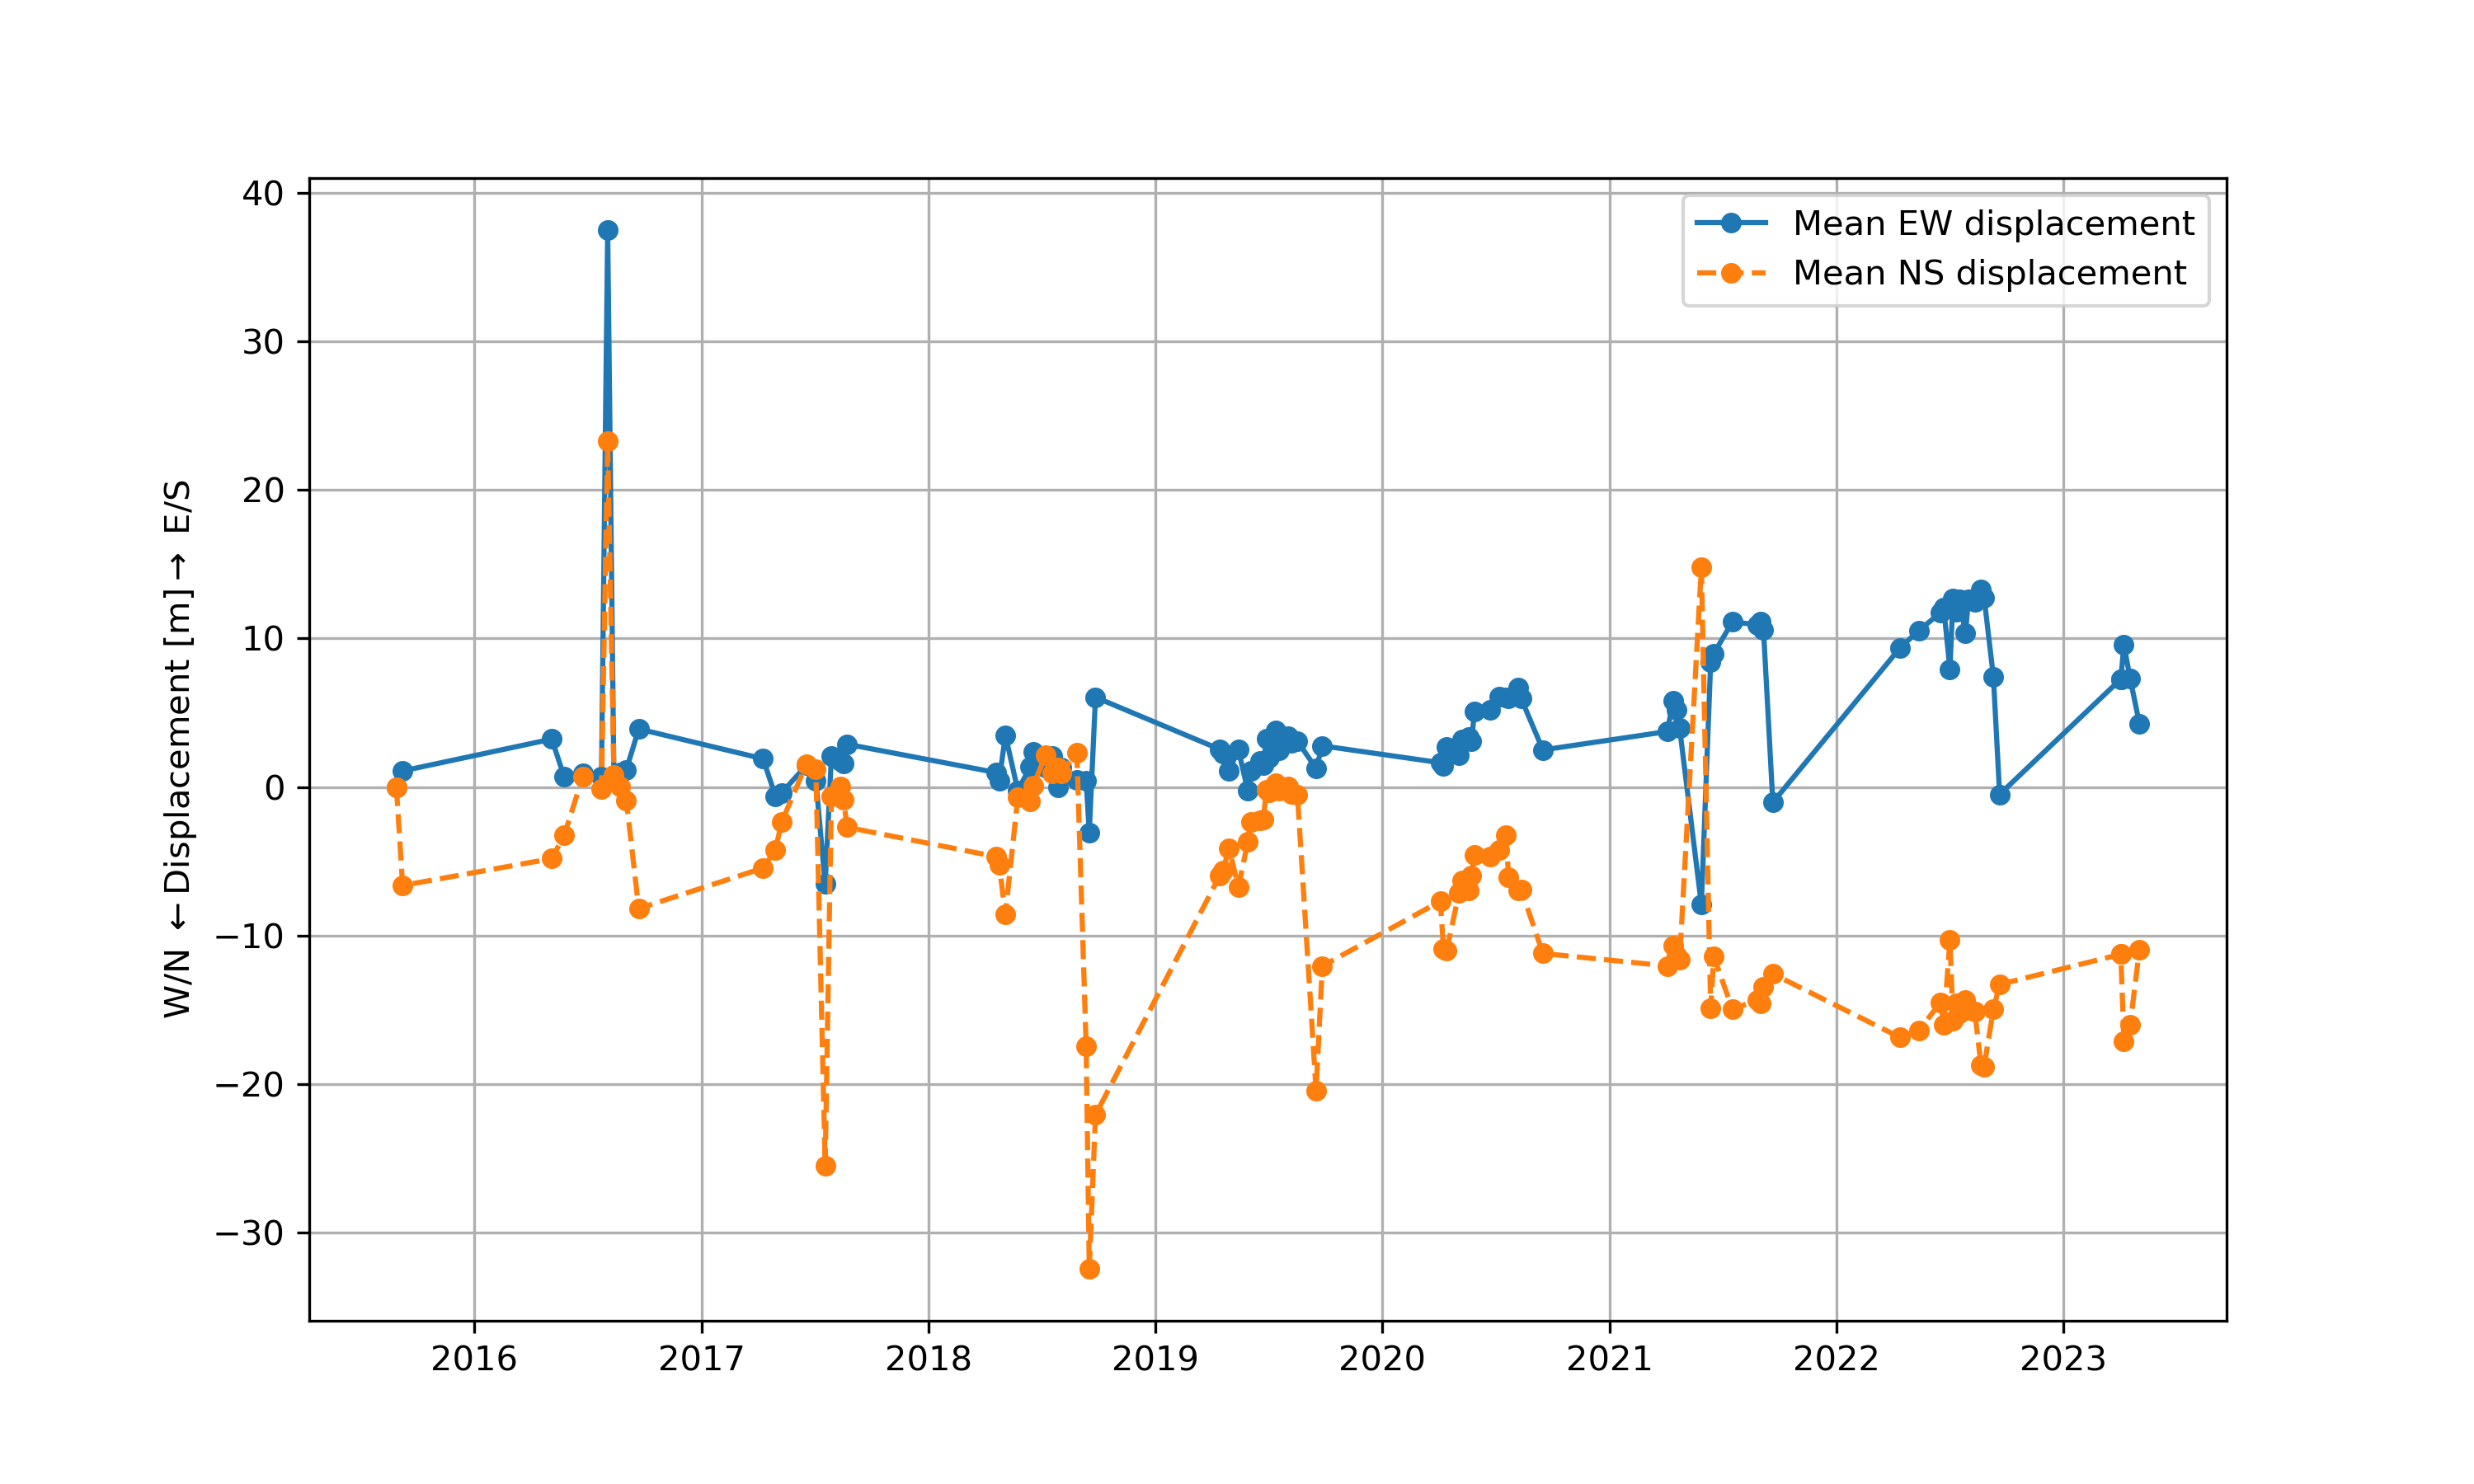
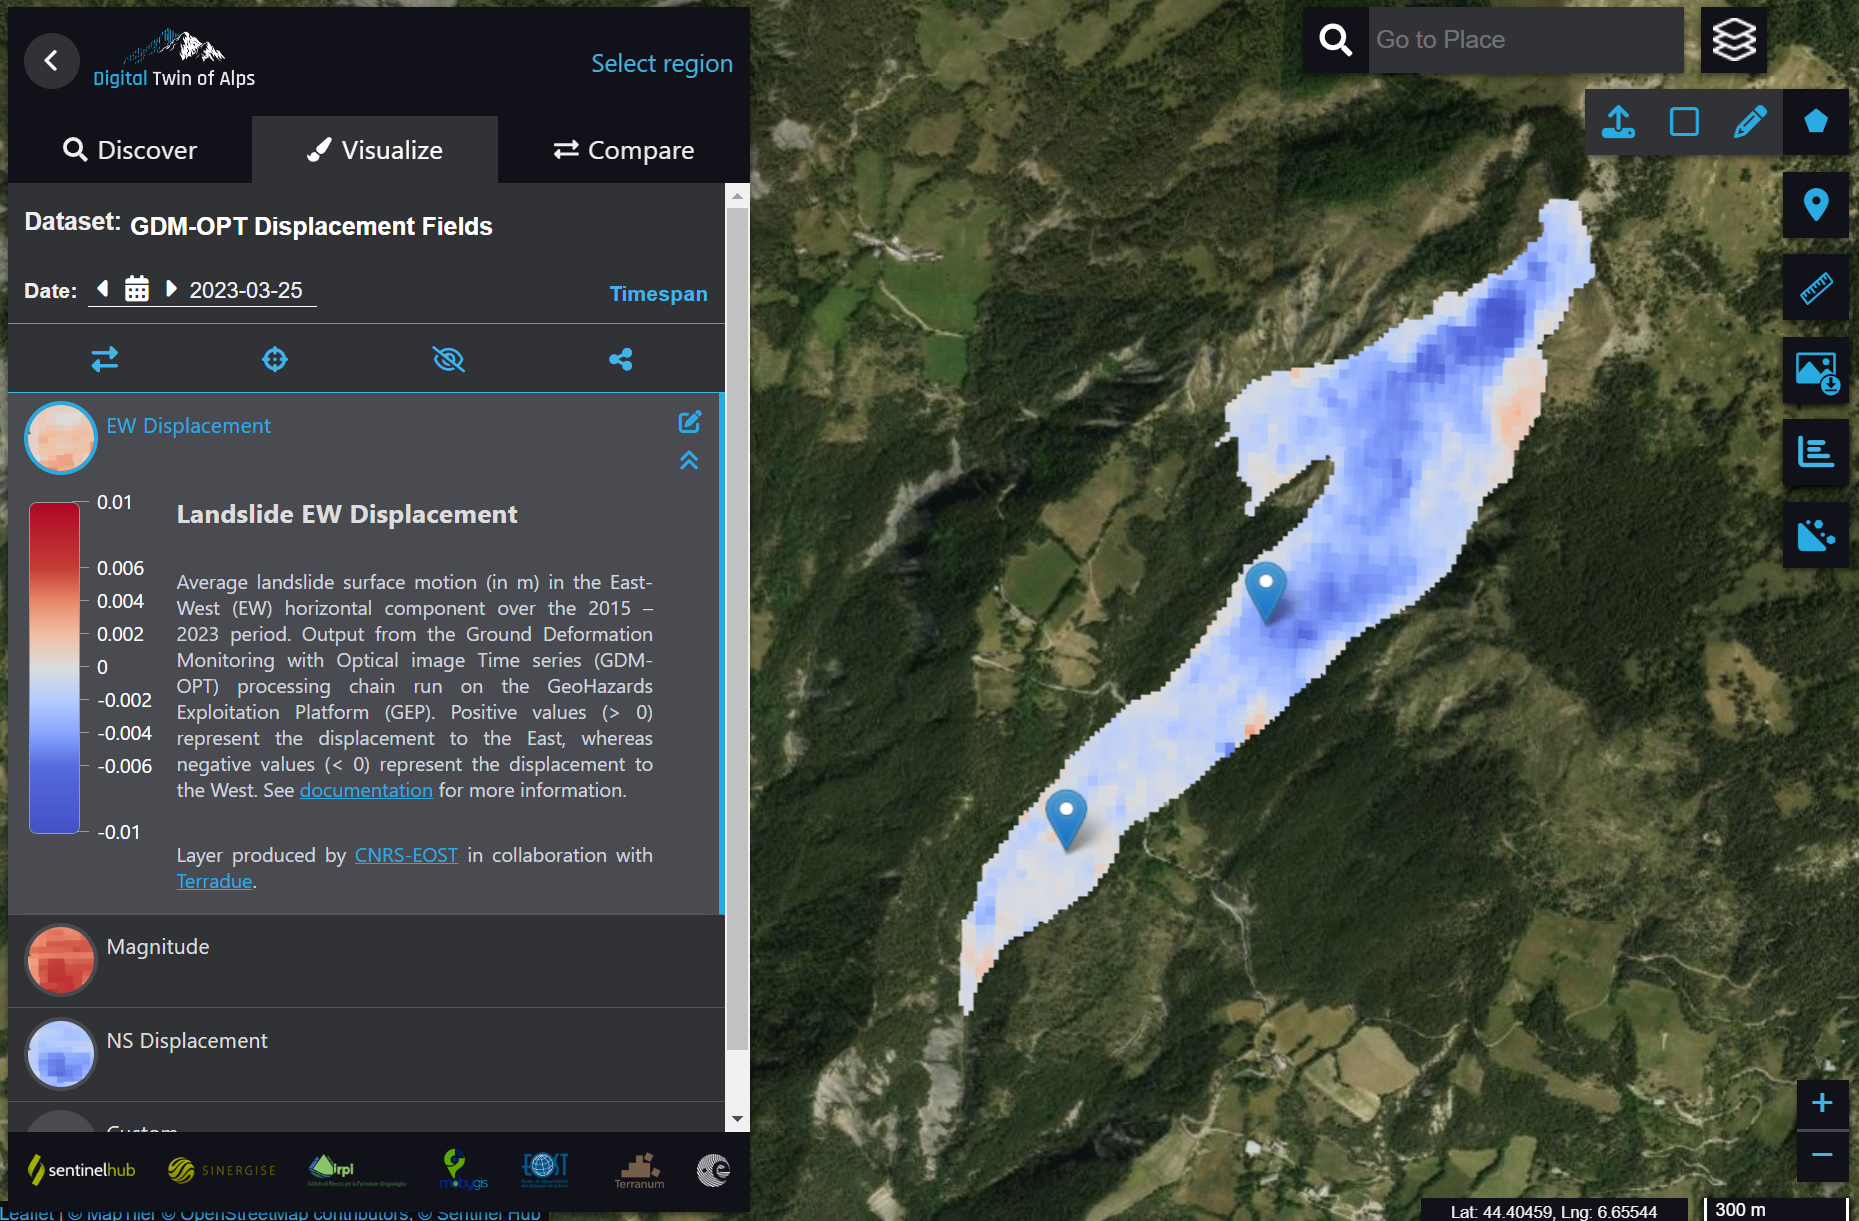
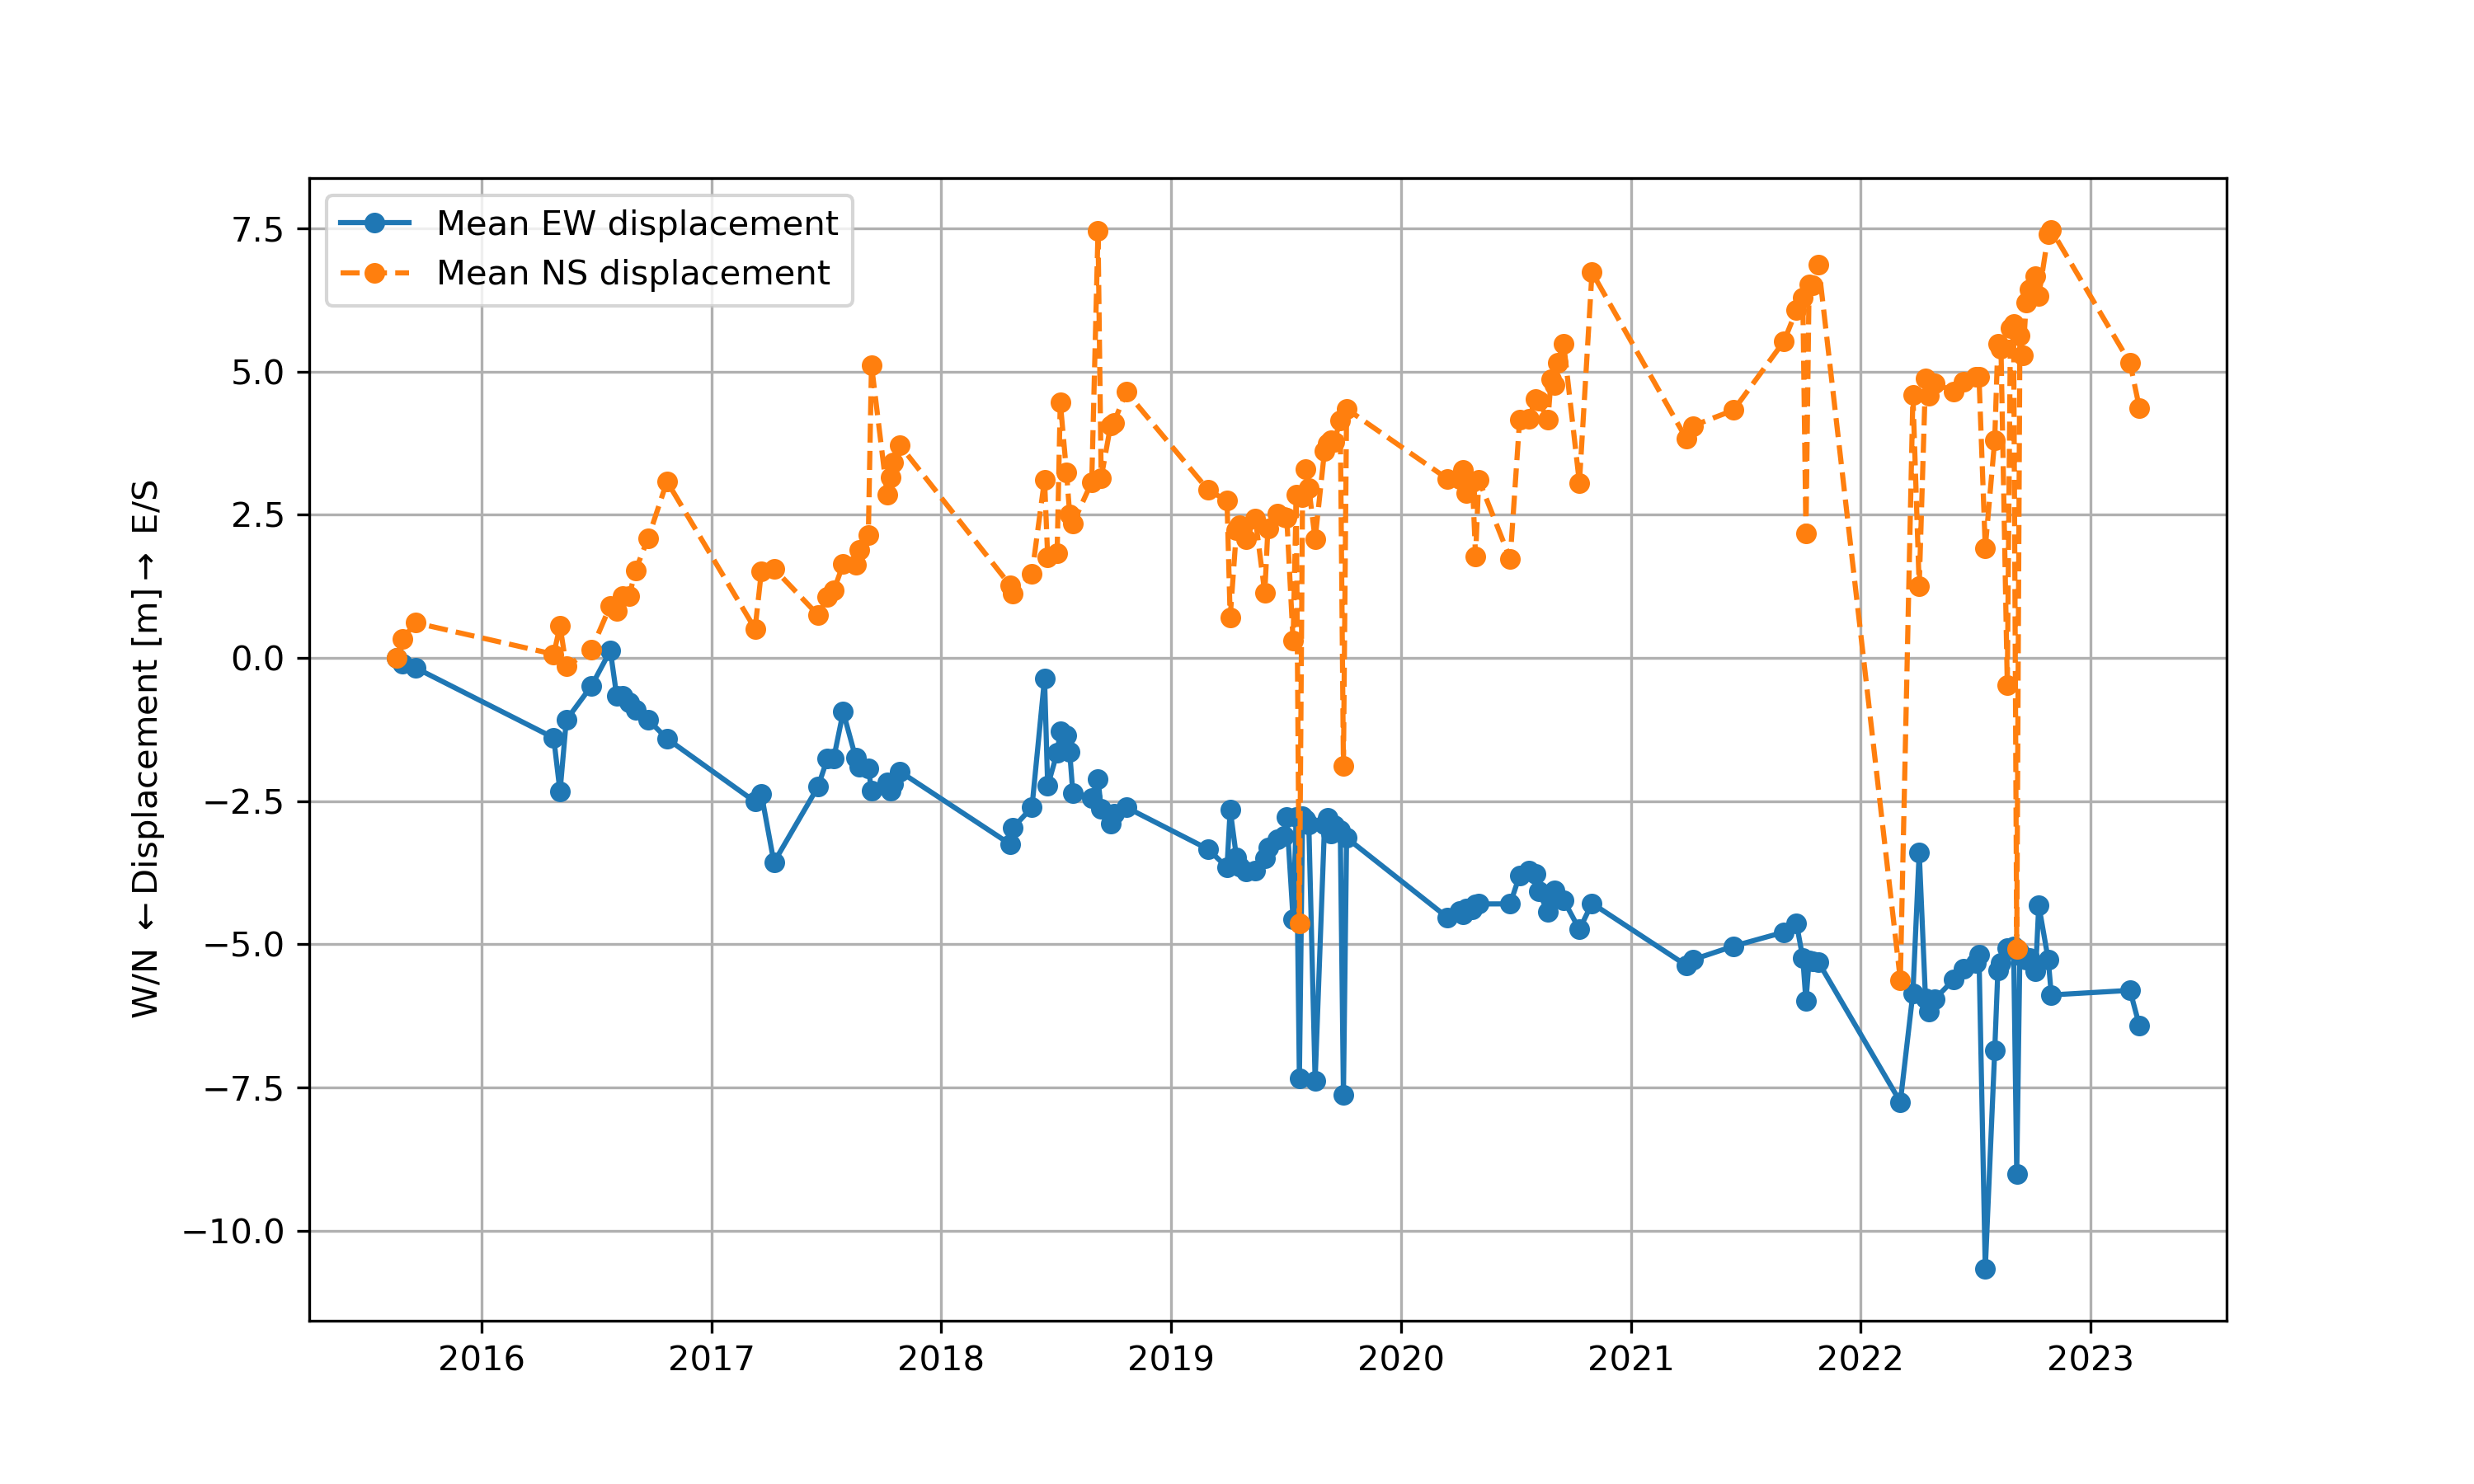
- Average horizontal East - West displacement map (in m)
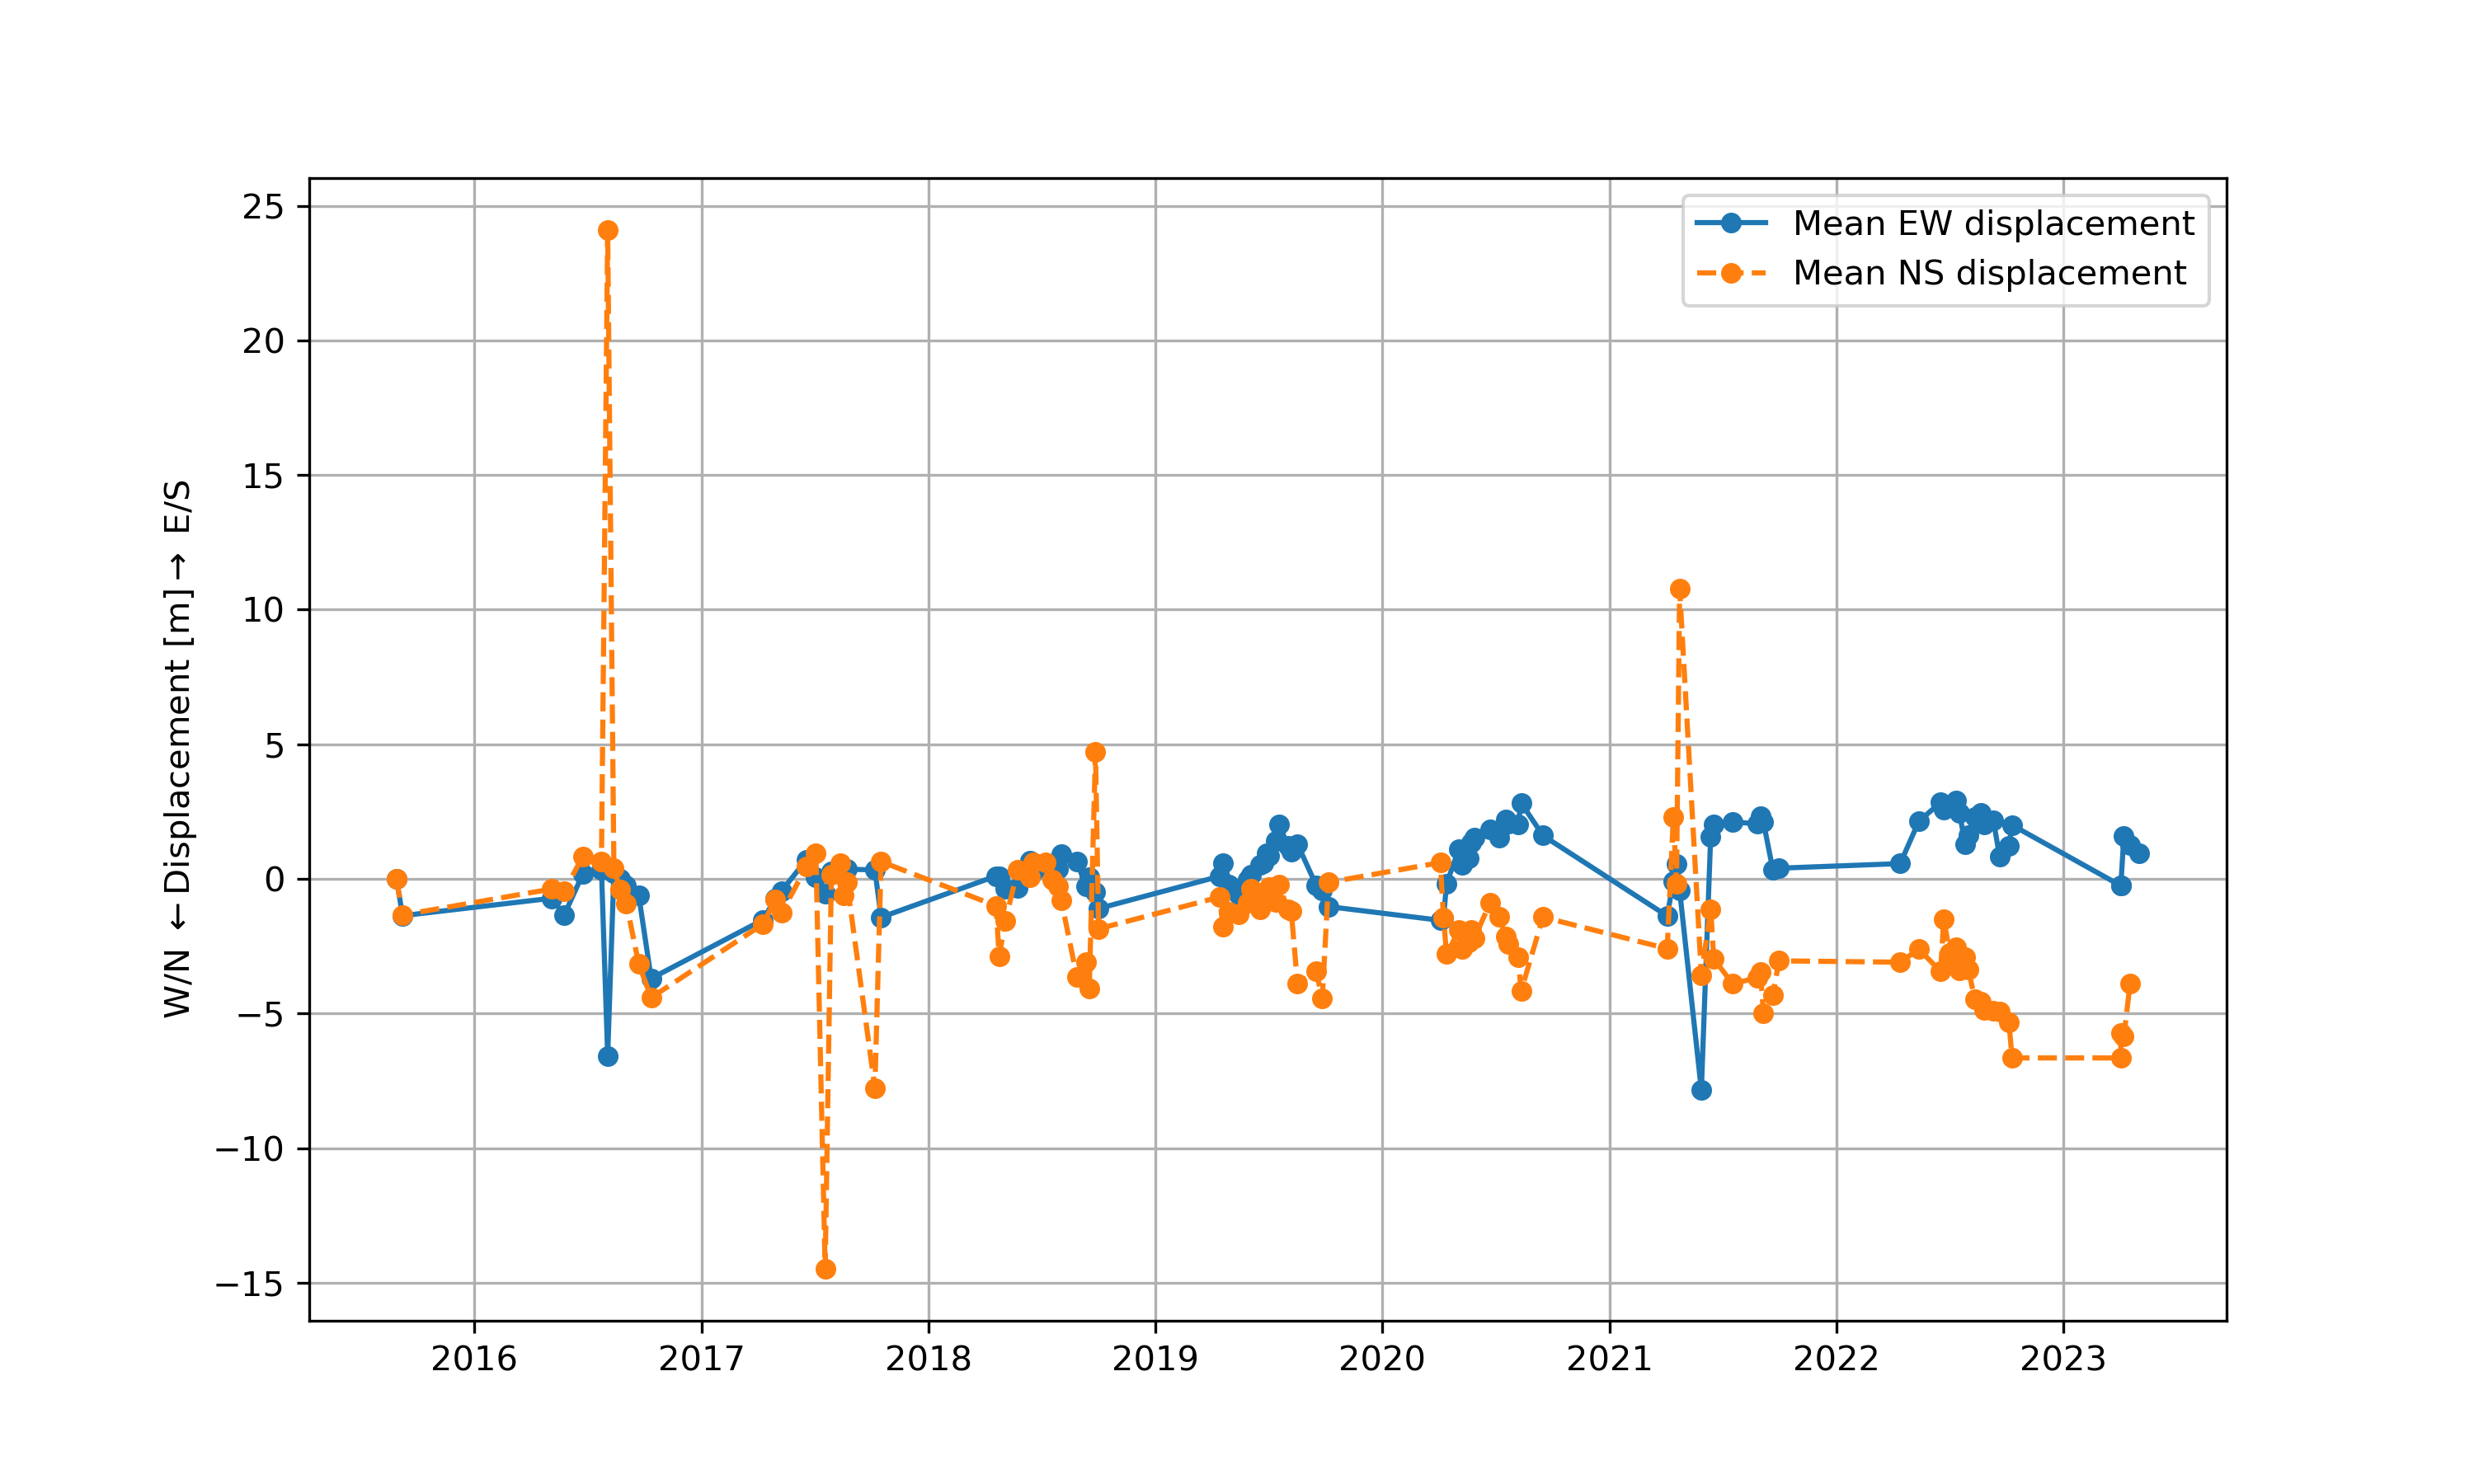
- Average horizontal North - South displacement map (in m)
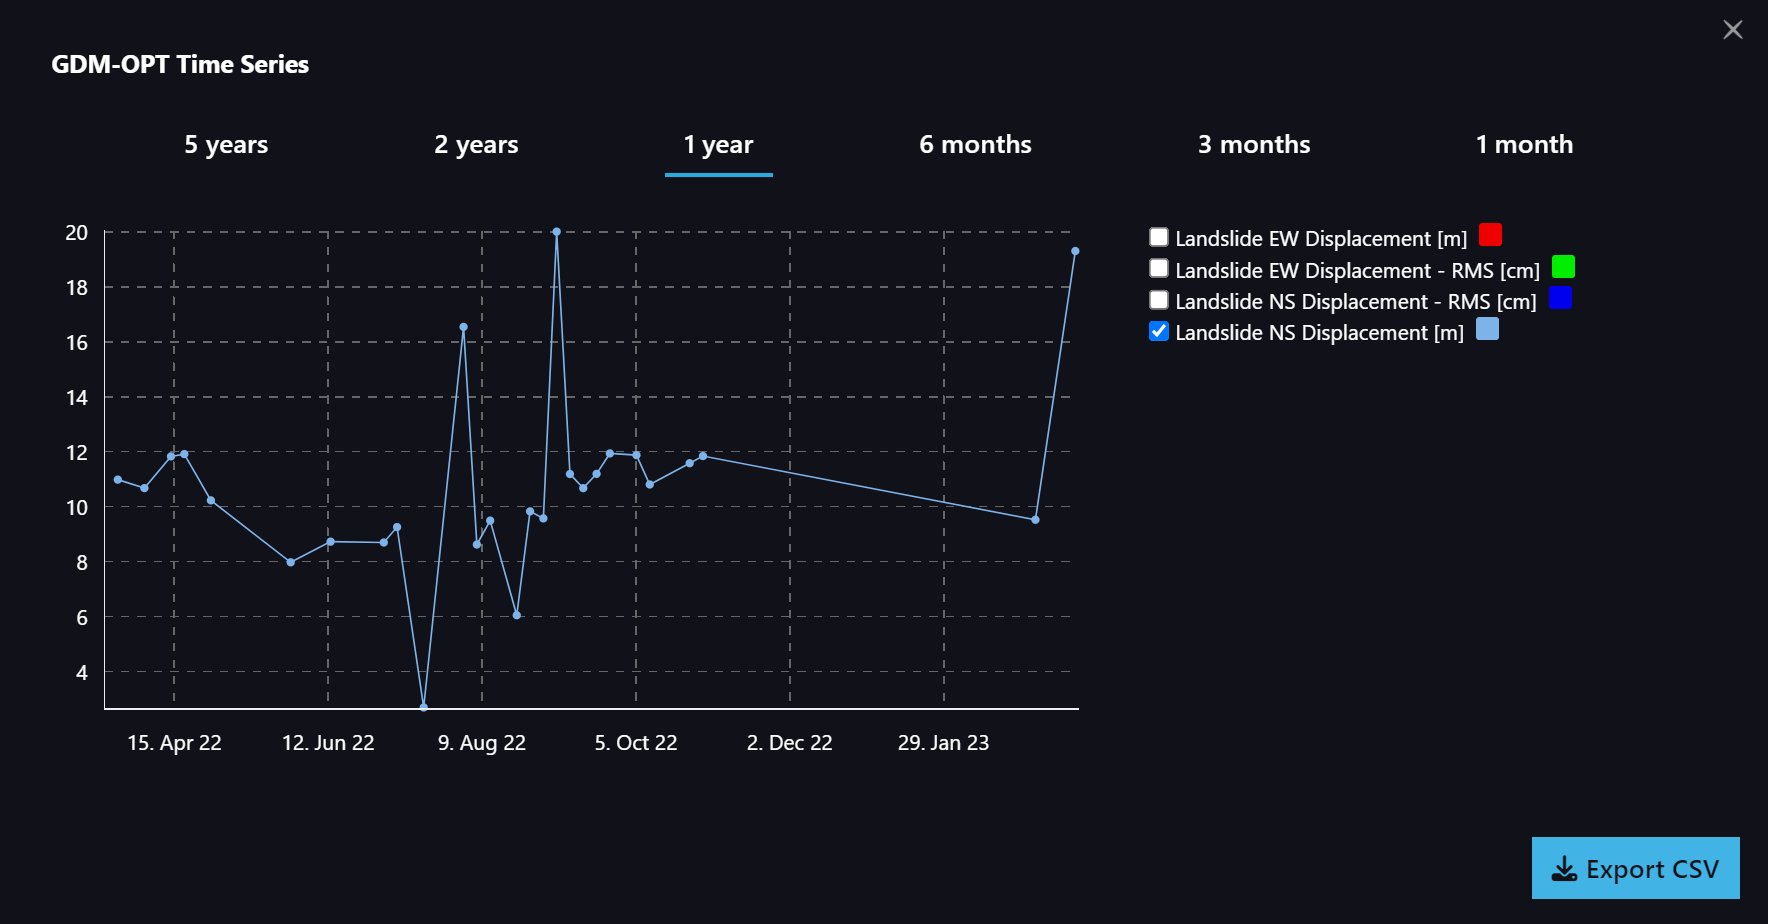
- Time series East - West displacement maps (in m)
- Time series North - South displacement maps (in m)
- Quality indicator: Root Mean Square (RMS) time series of East - West displacement maps (in cm)
- Quality indicator: Root Mean Square (RMS) time series of North - South displacement maps (in cm)
Who is the service for?
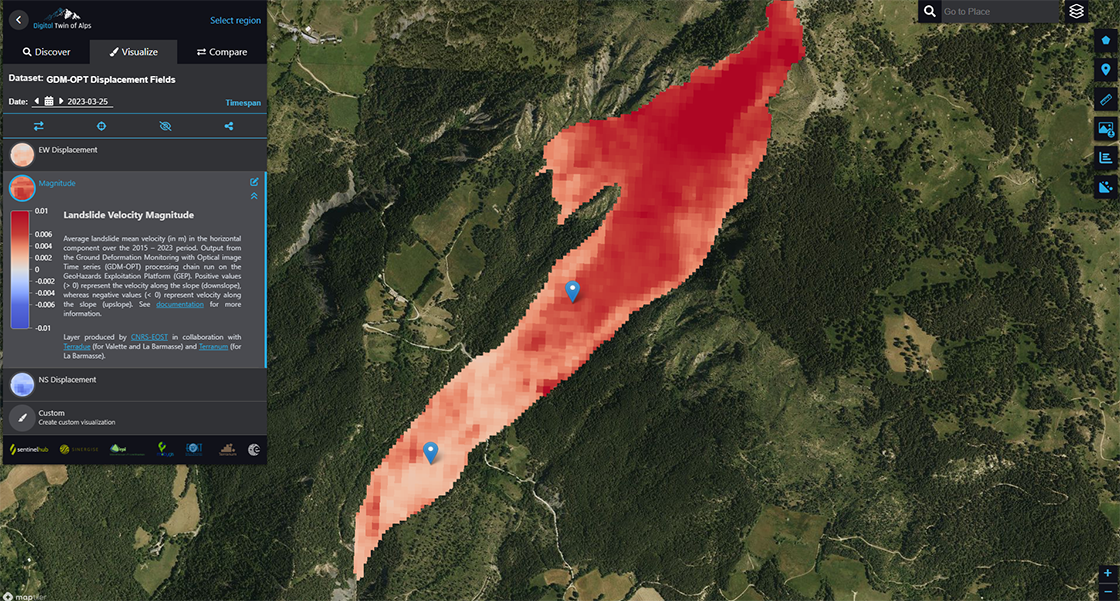
Average landslide velocity showcasing La Valette slope, France. Positive and negative values indicate upslope (blue pixels) and downslope velocities (red pixels), respectively. Blue pins are locations where in-situ measurements are available.

Terrain motion
Why monitor terrain motion?
What is the terrain motion processing chain?
How does the service work?
What products are available in the demonstrator?
- Ground motion time-series expressed in mm.
- Coherence between two complex SAR images expressing a measure of phase correlation (or phase reliability).
- Surface motion (velocity) along the line of sight (LoS) given in mm/year.
- Uncertainty in the estimation of LoS surface motion in mm/year.
Who is the service for?

Example of a surface motion product along the line of sight in Mont Blanc (France). White pixels represent no movement, positive values (in blue) indicate that the observed terrain is uplifting or moving towards the satellite, and negative values (in red) indicate subsidence or motion away from the satellite.
Products from external providers
- Average Line of Sight Velocities based on the period 2017 to 2021
- Average SARScape Slope Orientation velocities based on the period 2017 to 2021.
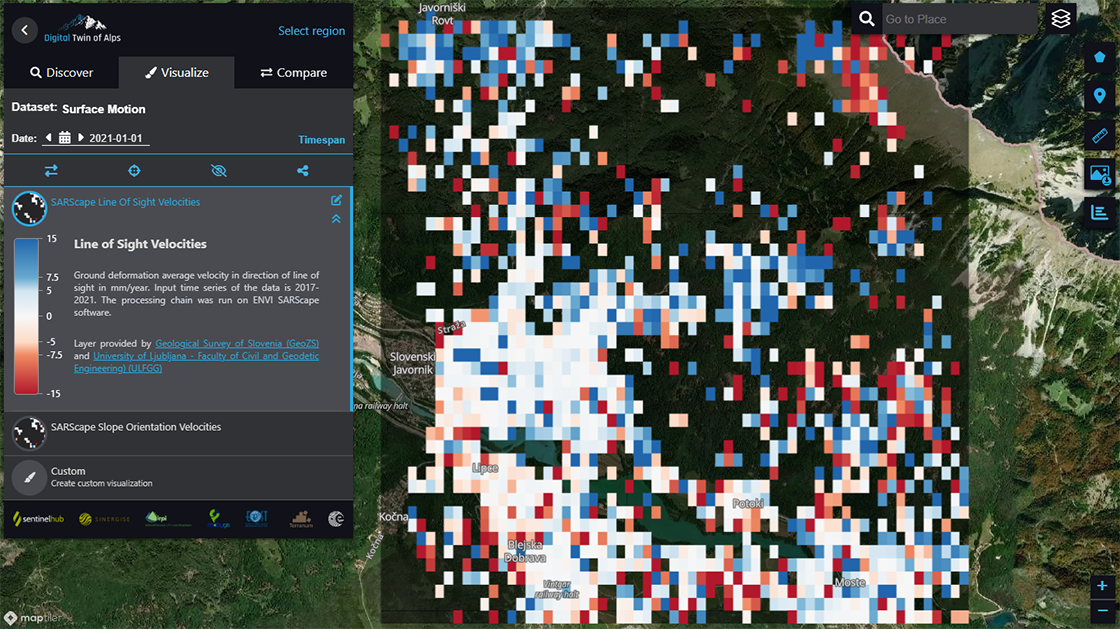
Example of the SARScape Line of Sight velocities product over Slovensky Javornik, Potoki, and Moste (Slovenia). White pixels represent no movement, positive values (in blue) indicate that the observed terrain is uplifting or moving towards the satellite, and negative values (in red) indicate subsidence or motion away from the satellite.

Glacier motion
Why monitor glacier motion?
What is the glacier motion processing chain?
How does the service work?
What products are available in the demonstrator?
- Mean glacier velocity in the East-West horizontal component (m/day)
- Mean glacier velocity in the North-South horizontal component (m/day)
- Mean velocity magnitude over all time steps (m/day)
- Time series of glacier surface motion (in m) in the East - West horizontal component
- Time series of glacier surface motion (in m) in the North - South horizontal component
- Time series of the glacier surface motion accuracy (in cm) for the East - West horizontal component
- Time series of the glacier surface motion accuracy (in cm) for the North - South horizontal component
Who is the service for?
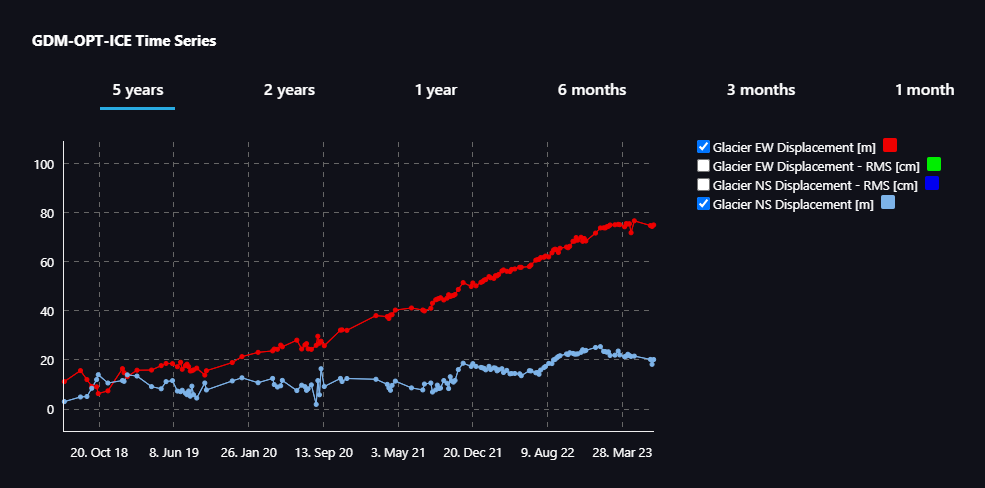
Example of glacier displacement time series in the East-West and North-South horizontal components extracted at a pixel level.
Precursor projects: Alps regional initiatives

Project description
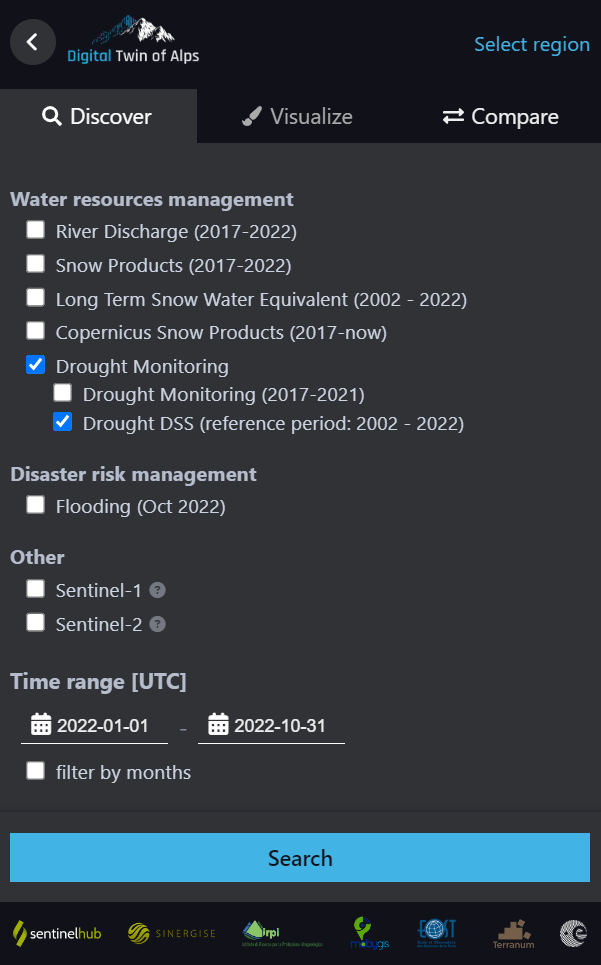
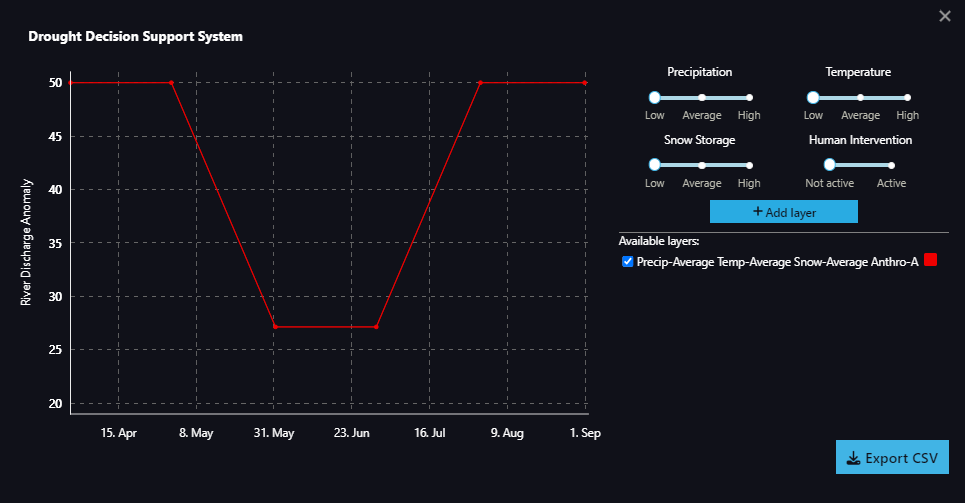
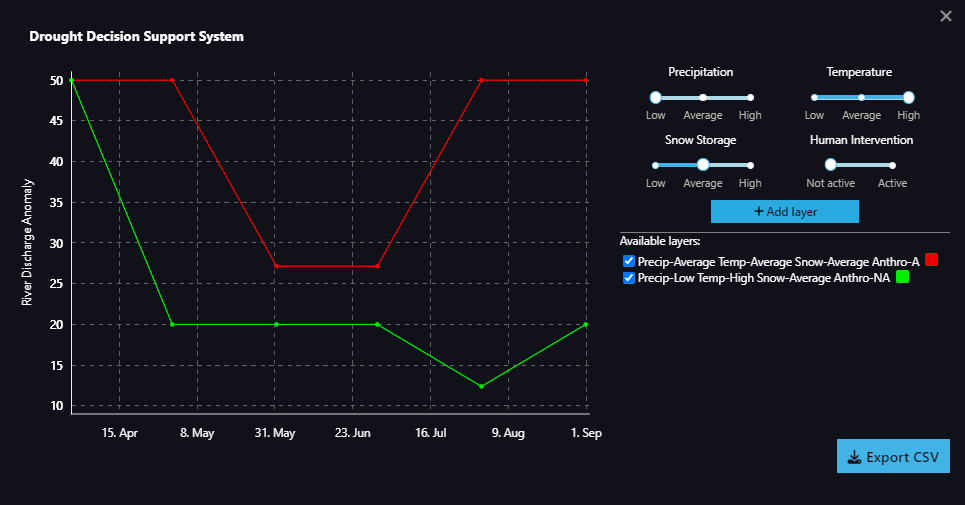
Decision Support System


 on the right of the Browser panel is deactivated (greyed out). In order to activate it, click on the Compare tab in the left panel.


 and download images
  . Follow a video tutorial on the website to navigate through the additional functionalities of the demonstrator platform.
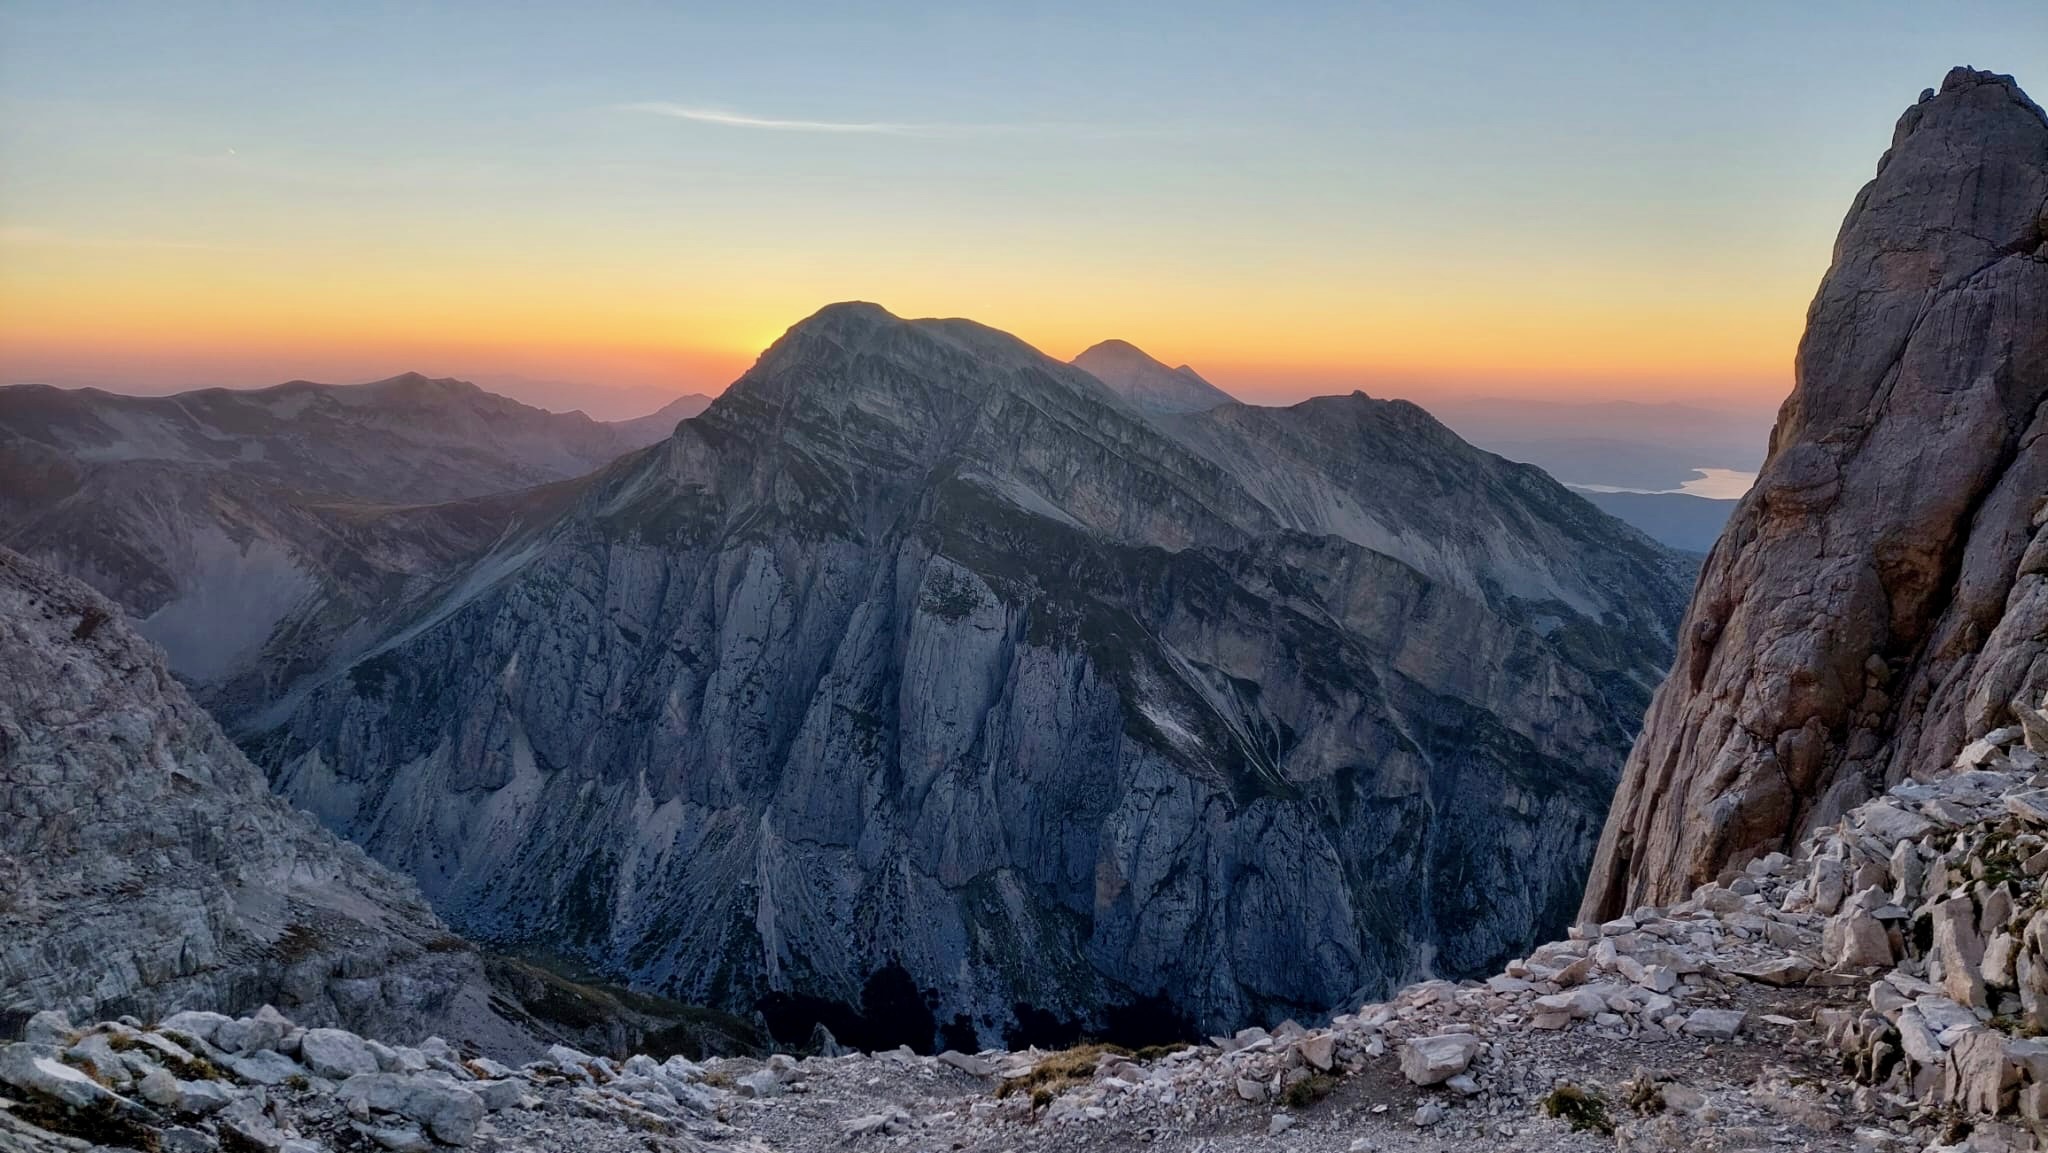


 at the bottom of the right panel.
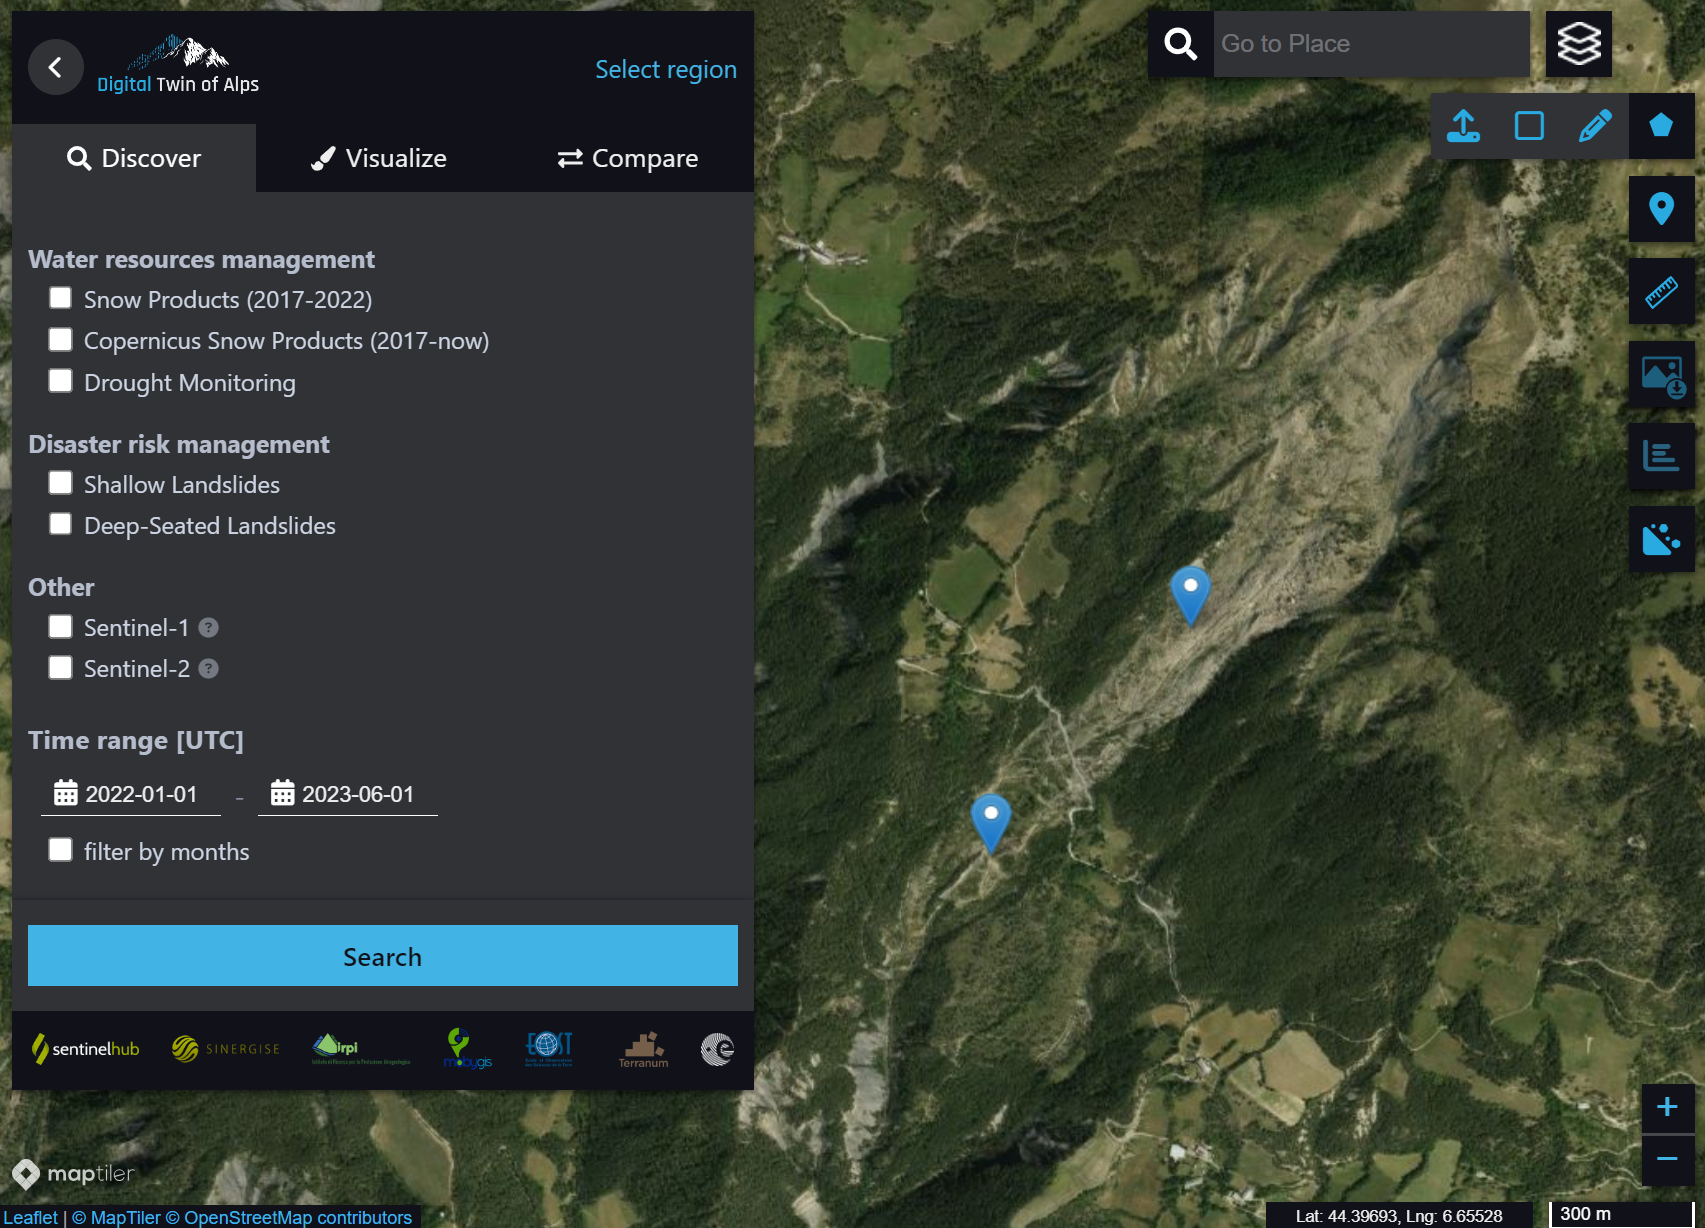
 to visualise the measurements.
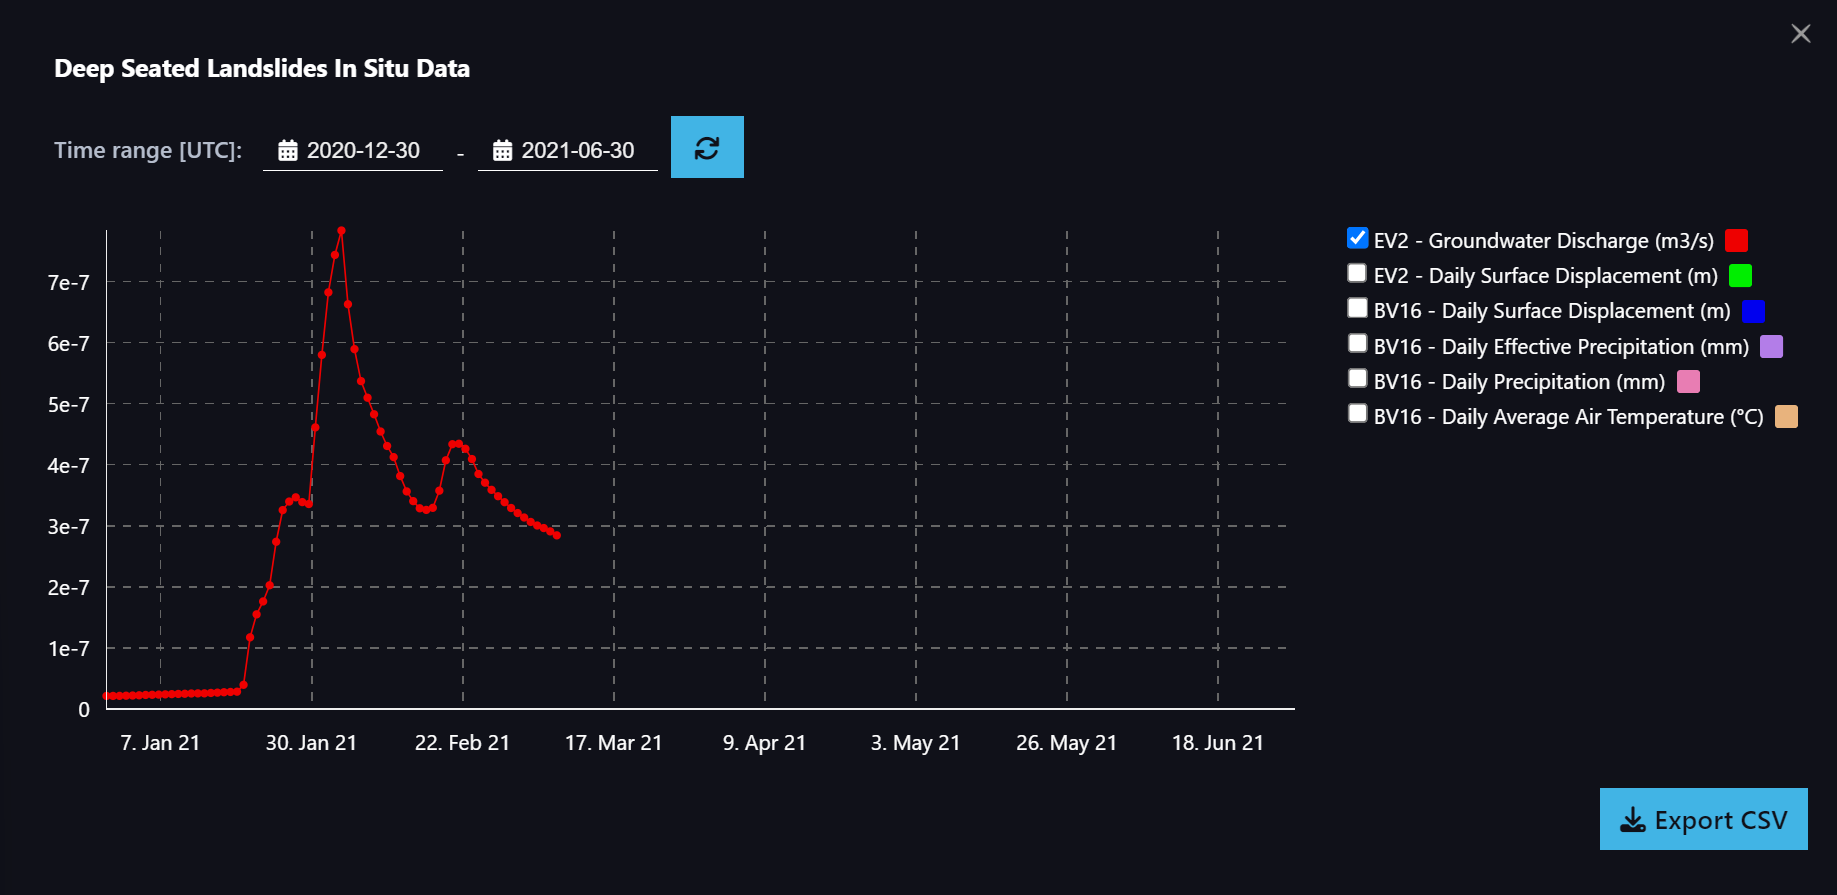
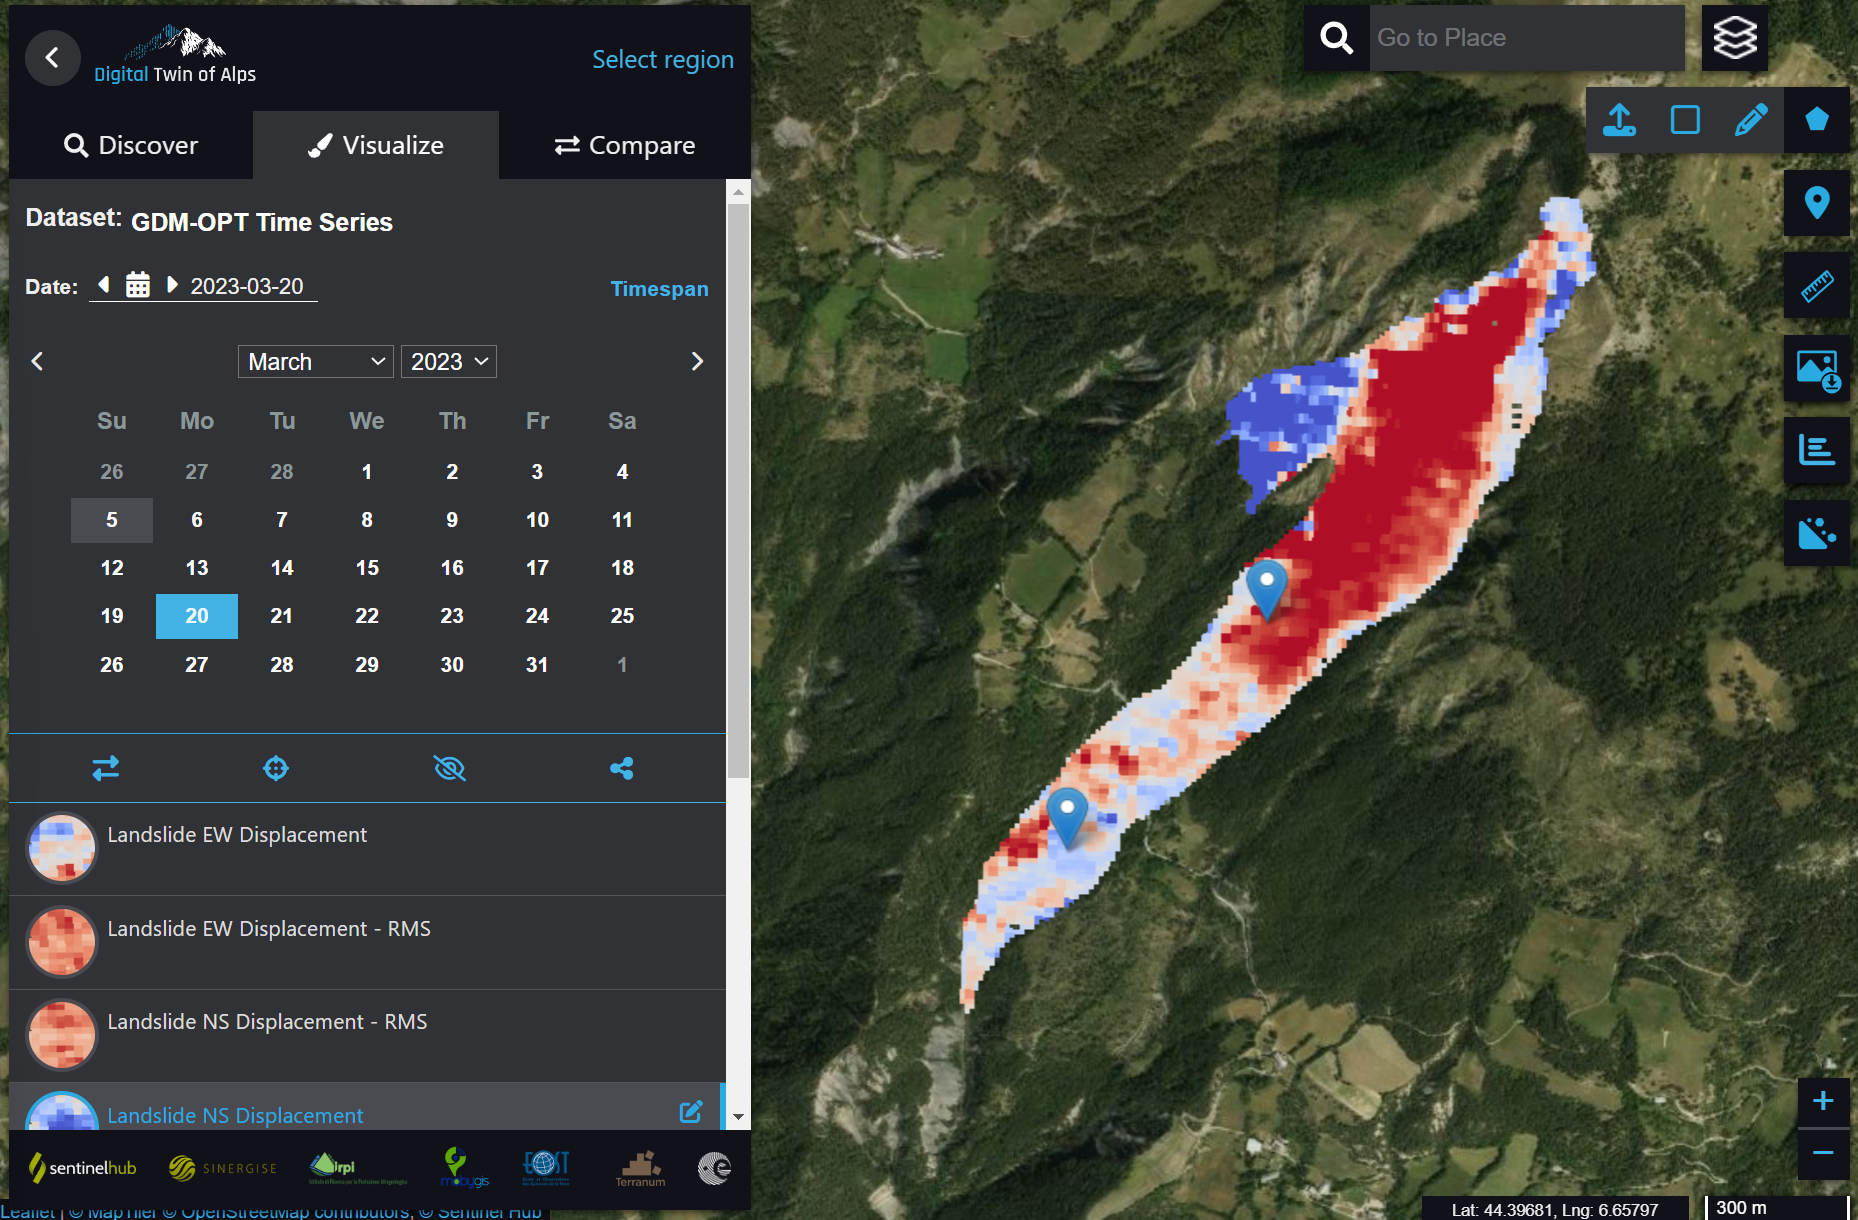
 and place the yellow pin at a specific point from which time series and statistics want to be obtained. Then, proceed to click on the Statistical info
  icon.
icon.
 icon and then click on Draw rectangular area of interest
  . Draw a polygon that covers the whole region. Next, click on the Statistical info
About us
ESA Contract No. 4000139281/22/I-DT
Consortium
 |
Sentinel Hub GmbH, Austria Maxim Lamare, Lucia Guardamino |
 |
Sinergise d.o.o., Slovenia Grega Milcinski, Primoz Drobnic |
  |
EOST/A2S Université de Strasbourg, France Jean Philippe Malet |
 |
Terranum Sàrl, Switzerland Clément Michoud, Thierry Oppikofer |
 |
MobyGIS, Italy Matteo Dall’Amico, Nicolò Franceschetti, Federico Di Paolo |
 |
CNR-IRPI, Italy Stefania Camici, Hamidreza Mosaffa, Sara Modanesi, Luca Brocca |
Contact Us
Get the info you're looking for right now.
Project Management: Dr. Maxim Lamare
✖